Bullish GartleyBULL looks to be on it's way to forming a Bullish Gartley. The price should drop near $12, and then continue upward to the 1.618 FIB around $23.5 near the end of October to early November.
Next report date
—
Report period
—
EPS estimate
—
Revenue estimate
—
−0.9565 EUR
−21.92 M EUR
376.95 M EUR
169.53 M
About Webull Corporation
Sector
Industry
CEO
An Quan Wang
Website
Headquarters
St. Petersburg
Founded
2016
ISIN
KYG9572D1034
Webull Corp. engages in the provision of financial services. It offers trading, wealth management product distribution, market data and information, user community, and investor education. The company was founded by An Quan Wang in 2016 and is headquartered in St. Petersburg, FL.
Related stocks

Looks goodDescending channel about to be broken out. The 13 support level is holding up very well. Lots buyers in that area. Next stop after the breakout the 16 level. SL triggers if a daily candle breaks down and closes under the support level. This stock is very volatile, wait until it the daily candles cl

BULL - new favorite for 2026It has been very volatile and recently reported decent earnings as it sat at a very neutral chart. Sell the news moment.
I have been in and out several times since it hit under $11 and will continue to do so.
Current support is $13.15 area, if we lose that we could easily see $12 or below.
It do

BULL Earnings Play--Don’t Miss Out
# 🚀 BULL Earnings Play (8/28 AMC) 🚀
💎 **Moderate Bullish | 75% Conviction** 💎
🎯 **Trade Setup**
📊 Ticker: \ NASDAQ:BULL
🔀 Direction: CALL 📈
🎯 Strike: 15.00
📅 Expiry: 2025-08-29
💵 Entry: 0.46 (ASK)
⏰ Entry Timing: Pre-earnings close (8/28 AMC)
📦 Size: 1 contract (risk 💸 \$46)
📈 Profit Target: 1.

BULL: What are the next movements?BULL:
.
Those who went with the BULL plans from the bottom now understand why BULL is truly the golden goose.
What are the next movements?
.
US STOCKS- WALL STREET DREAM- LET'S THE MARKET SPEAK!

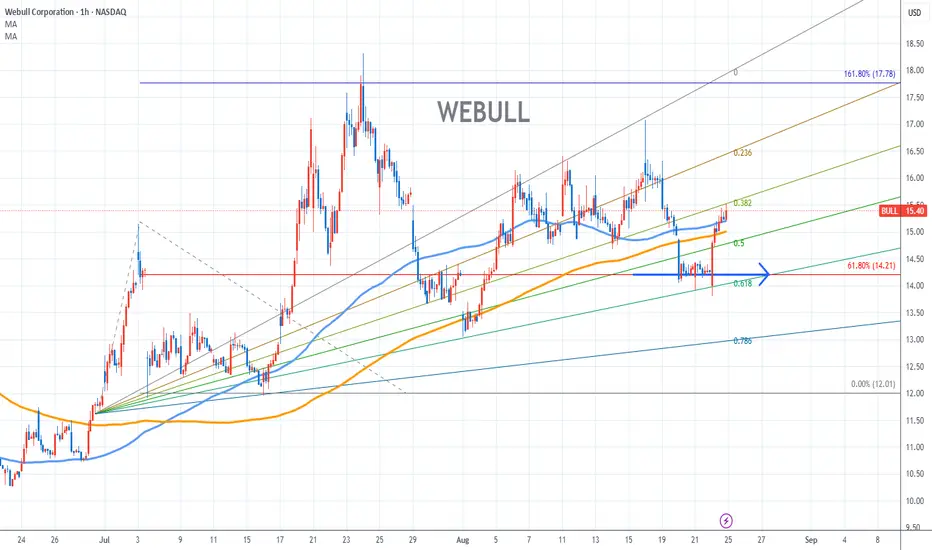
Webull Stock Chart Fibonacci Analysis 082225Trading Idea
1) Find a FIBO slingshot
2) Check FIBO 61.80% level
3) Entry Point > 14.2/61.80%
Chart time frame:B
A) 15 min(1W-3M)
B) 1 hr(3M-6M)
C) 4 hr(6M-1year)
D) 1 day(1-3years)
Stock progress:A
A) Keep rising over 61.80% resistance
B) 61.80% resistance
C) 61.80% support
D) Hit the bottom
E
Bullish on BULLBULL offers an interesting opportunity. We've seen the potential of tech-focused trading companies such as Robinhood and what a strong & consistent user base can lead to in terms of shareholder return.
BULL offers something similar.
While I'm not personally a user, I know that I see it everywhe

WeBull Corporation | BULLOver the past few days, specifically from August 6th to August 15th, NASDAQ:BULL has been in a sideways position. Then, on August 16th, NASDAQ:BULL confirmed a breakout from the sideways movement. Therefore, we can target a minimum price of $18 with the potential for up to $20.

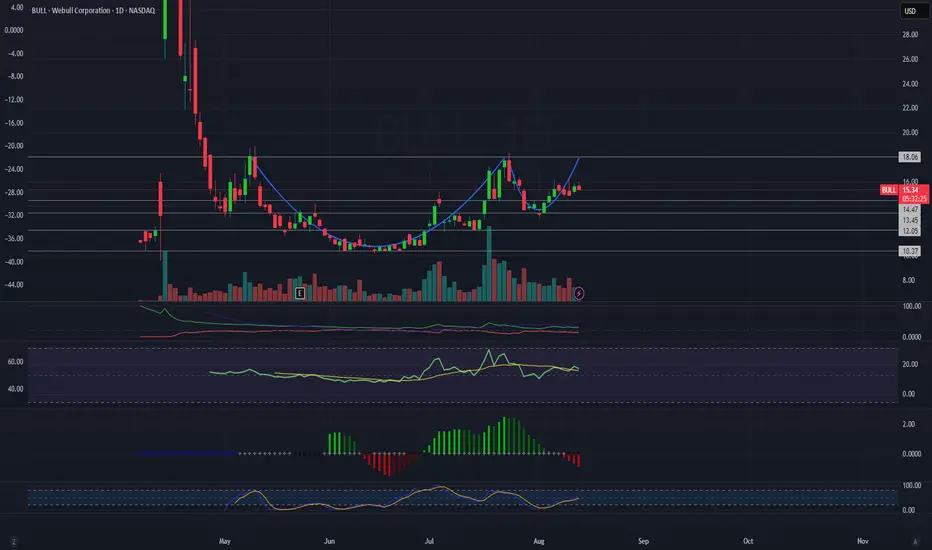
BULL – Cup & Handle Breakout Setup with Strong MACD & RSI SupporBULL is showing a textbook Cup & Handle formation on the daily chart, signaling a potential bullish breakout if key resistance is cleared. The price is consolidating just under the $18.06 level after a healthy pullback – a classic setup for a continuation move.
Technical Highlights:
Pattern: Cup &
BULL: What will be next?BULL
.
The market keeps repeating familiar charts, the same patterns to the point of boredom.
What are you seeing on BULL: I just see a bull ahead!
.
US STOCKS- WALL STREET DREAM- LET'S THE MARKET SPEAK!

See all ideas
Summarizing what the indicators are suggesting.
Neutral
SellBuy
Strong sellStrong buy
Strong sellSellNeutralBuyStrong buy
Neutral
SellBuy
Strong sellStrong buy
Strong sellSellNeutralBuyStrong buy
Neutral
SellBuy
Strong sellStrong buy
Strong sellSellNeutralBuyStrong buy
An aggregate view of professional's ratings.
Neutral
SellBuy
Strong sellStrong buy
Strong sellSellNeutralBuyStrong buy
Neutral
SellBuy
Strong sellStrong buy
Strong sellSellNeutralBuyStrong buy
Neutral
SellBuy
Strong sellStrong buy
Strong sellSellNeutralBuyStrong buy
Frequently Asked Questions
The current price of A40Z5Y is 11.8250 EUR — it has increased by 9.80% in the past 24 hours. Watch Webull Corporation stock price performance more closely on the chart.
Depending on the exchange, the stock ticker may vary. For instance, on LS exchange Webull Corporation stocks are traded under the ticker A40Z5Y.
A40Z5Y stock has risen by 1.90% compared to the previous week, the month change is a −10.25% fall, over the last year Webull Corporation has showed a 27.26% increase.
We've gathered analysts' opinions on Webull Corporation future price: according to them, A40Z5Y price has a max estimate of 15.44 EUR and a min estimate of 15.44 EUR. Watch A40Z5Y chart and read a more detailed Webull Corporation stock forecast: see what analysts think of Webull Corporation and suggest that you do with its stocks.
A40Z5Y reached its all-time high on Jul 23, 2025 with the price of 15.2600 EUR, and its all-time low was 9.2920 EUR and was reached on Jun 20, 2025. View more price dynamics on A40Z5Y chart.
See other stocks reaching their highest and lowest prices.
See other stocks reaching their highest and lowest prices.
A40Z5Y stock is 8.92% volatile and has beta coefficient of −0.51. Track Webull Corporation stock price on the chart and check out the list of the most volatile stocks — is Webull Corporation there?
Today Webull Corporation has the market capitalization of 5.37 B, it has decreased by −9.65% over the last week.
Yes, you can track Webull Corporation financials in yearly and quarterly reports right on TradingView.
Webull Corporation is going to release the next earnings report on Dec 3, 2025. Keep track of upcoming events with our Earnings Calendar.
A40Z5Y net income for the last quarter is −24.00 M EUR, while the quarter before that showed 12.10 M EUR of net income which accounts for −298.43% change. Track more Webull Corporation financial stats to get the full picture.
No, A40Z5Y doesn't pay any dividends to its shareholders. But don't worry, we've prepared a list of high-dividend stocks for you.
As of Sep 12, 2025, the company has 1.19 K employees. See our rating of the largest employees — is Webull Corporation on this list?
Like other stocks, A40Z5Y shares are traded on stock exchanges, e.g. Nasdaq, Nyse, Euronext, and the easiest way to buy them is through an online stock broker. To do this, you need to open an account and follow a broker's procedures, then start trading. You can trade Webull Corporation stock right from TradingView charts — choose your broker and connect to your account.