ALB - 2 times book and great cashflowWe like Albemarle here for a move up to the mid-200's based on valuation and cash flow.
Trade ideas

ALB Relative Performance at the Juncture of Breaking down/out$ALB cheap @ 9x FPE but technical is poor relative to #SPY, #IWF #XLB. This week is critical could break relative uptrend to all 3 ETFs. Though daily RSI could bounce weekly still in downtrend, bounce will be retested. Next Support @ 186. MS' PT 155 siting oversupply of Lithium.

#ALB to 170$?Hello dear Traders,
Here is my idea for #ALB
Price closed below yellow line (previous month low)
Price closed in 15 Minute chart below purple trigger line -> Enter Trade.
Targets marked in the chart (green lines)
Invalidation level marked with red line
Good luck!
❤️Please feel free to ask any question in comments. I will try to answer all! Thank you.
Please, support my work with like, thank you!❤️

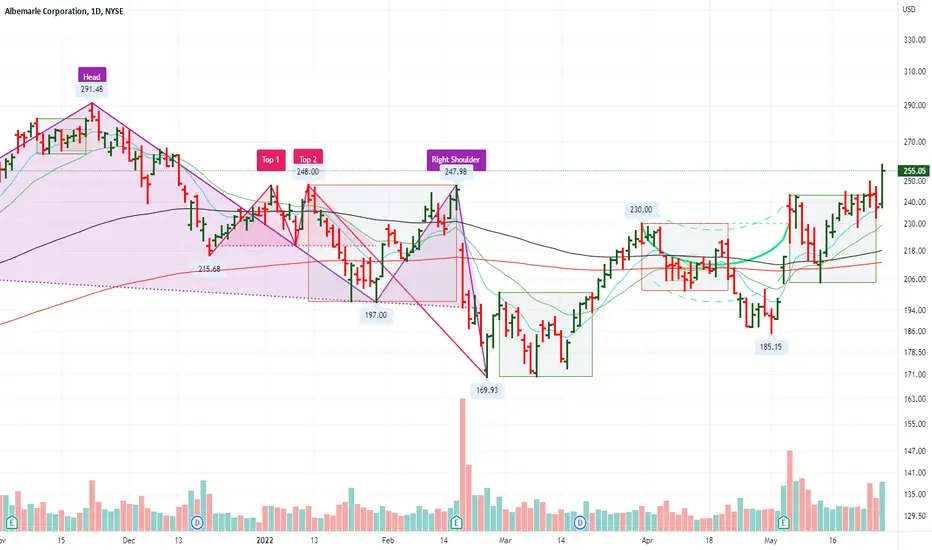
$ALB Continuation Head and Shoulders SetupEarning volatility last Thursday on $ALB causing 13%+ wide swing from potential breakout level.
That also created the right shoulder of a head and shoulders continuation pattern.
We can all agree though that today as TIGHT.
9/28/22 ALBAlbemarle Corporation ( NYSE:ALB )
Sector: Process Industries (Chemicals: Specialty)
Market Capitalization: $31.587B
Current Price: $277.95
Breakout price: $297.50
Buy Zone (Top/Bottom Range): $275.50-$250.30
Price Target: $364.40-$369.30 (3rd)
Estimated Duration to Target: 152-162d (3rd)
Contract of Interest: $ALB 3/17/23 320c
Trade price as of publish date: $32.20/contract

$ALB long ideaHello dear Traders,
Here is my idea for #ALB
Daily close above the yellow trigger line (previous month high) to enter trade.
We try to anticipate a 3-2-2 bullish reversal in the weekly chart - price found support at monthly pivot Line
Momentum: Weekly UP, Monthly UP
LIT ETF with IV30% Rank = 9%
Targets marked in the chart (black lines)
Invalidation level marked with red line
Please feel free to ask any question in comments. I will try to answer all! Thank you

Is Albemarle Trying to Break Out?Alternate energy has shown relative strength since the Inflation Reduction Act took effect in August. Lithium provider Albemarle is a potential beneficiary.
The first pattern on today’s chart is the trendline running along the highs of November and June. ALB ripped through that line three weeks ago before pulling back. It’s now attempting to bounce at the same area, which could mean old resistance has become new support.
Second, consider how the stock made a new 52-week high in late August. It was one of only eight members of the S&P 500 to achieve that feat at the time, according to TradeStation data.
Around the same time, ALB’s 50-day simple moving average (SMA) rose above its 200-day SMA -- a potentially bullish “golden cross.”
Next, the series of higher lows since March may reflect accumulation by longer-term investors. This longer-term trend is also visible in basing patterns on the weekly chart below.
Finally, the most recent pullback dragged ALB’s stochastic oscillator into an oversold condition.
TradeStation has, for decades, advanced the trading industry, providing access to stocks, options, futures and cryptocurrencies. See our Overview for more.
Important Information
TradeStation Securities, Inc., TradeStation Crypto, Inc., and TradeStation Technologies, Inc. are each wholly owned subsidiaries of TradeStation Group, Inc., all operating, and providing products and services, under the TradeStation brand and trademark. You Can Trade, Inc. is also a wholly owned subsidiary of TradeStation Group, Inc., operating under its own brand and trademarks. TradeStation Crypto, Inc. offers to self-directed investors and traders cryptocurrency brokerage services. It is neither licensed with the SEC or the CFTC nor is it a Member of NFA. When applying for, or purchasing, accounts, subscriptions, products, and services, it is important that you know which company you will be dealing with. Please click here for further important information explaining what this means.
This content is for informational and educational purposes only. This is not a recommendation regarding any investment or investment strategy. Any opinions expressed herein are those of the author and do not represent the views or opinions of TradeStation or any of its affiliates.
Investing involves risks. Past performance, whether actual or indicated by historical tests of strategies, is no guarantee of future performance or success. There is a possibility that you may sustain a loss equal to or greater than your entire investment regardless of which asset class you trade (equities, options, futures, or digital assets); therefore, you should not invest or risk money that you cannot afford to lose. Before trading any asset class, first read the relevant risk disclosure statements on the Important Documents page, found here: www.tradestation.com .

ALB - Channel Resistance Turned Support Break out of the ascending parallel channel
This channel top will now likely act as a support for price, as indicated by the double curve
Weekly timeframe

WATCH $ALBBearish
Fundamental
- Inflationary macro environment / fear sentiment
- Funds Distribution
- High PE
- Decent PEG
- Decent P/FCF
- Strong Sector / Industry / Not Leader
- Decent earnings
- Decent fundamental
Technical
- Momentum Theory Indicator - H&S formation momentum
- Price action formation ( rising wedge )
- Broke upward Trend line and retest previous high forming double tops
- Price below 200MA
- High volume node at peak
- Potential cup and handle formation
Entry idea
- Entry idea was based on few confluences
- Break of neckline and retest
- Momentum broke neckline
Stop loss depending on entry and risk appetite. But always set meaningful stops.
"the distance between dreams and reality is called action"
Cheers and happy trading!

$ALB New Up Trend?$ALB Looks to have started a new uptrend with a series of Higher Lows and Higher Highs. It looks to be right at a short-term resistance level. I have an alert just above today’s high which is also in the resistance area. If it can get over and close above 226 – 227 area, I will be looking to go long with a target area around 247. See markups on chart. This may be a good play for the EV space. Ideas, not investing / trading advice.

$ALB with a Bullish outlook following its earnings #Stocks The PEAD projected a Bullish outlook for $ALB after a Positive over reaction following its earnings release placing the stock in drift B with an expected accuracy of 50%.

ALB - Upward ChannelALB is within a strong upward channel on the Weekly chart
right now it is testing the upper band
A rejection may follow as has been seen in the past, leaving price to return to the 200MA in white
Price is still within a strong upward channel and should be treated bullishly

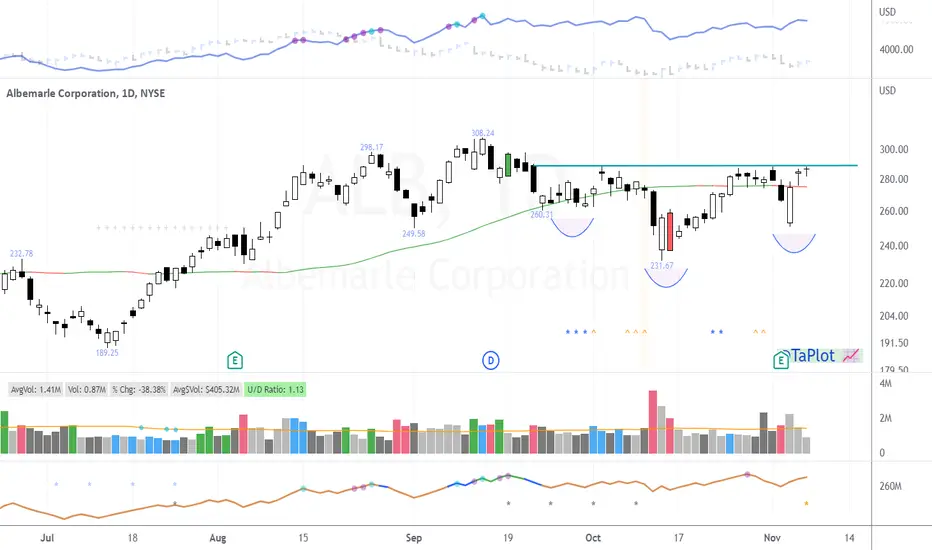
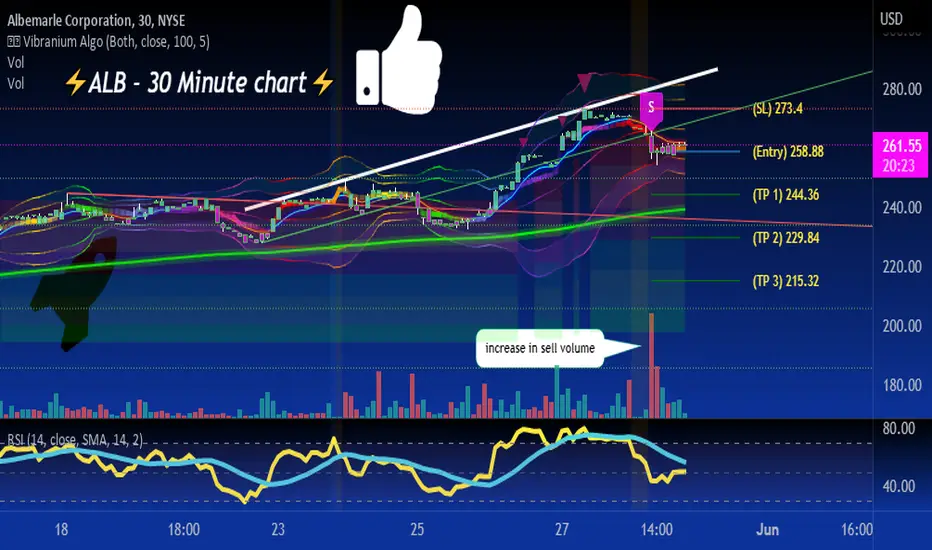
should see a small pullback 🦉ALB lower high on bigger timeframes and looking bearish on smaller ones as well.
we can target 244-229-215 in the next few weeks or so
ALB BreakoutALB Made New 6 Months Highs
Clean Text Book Base Breakout
5 Month Long Base
Heavy Volume coming in last 2 days
Price now trading above 200 DMA
Previous All Time Highs at 291.48, keep an eye on this level
Institutional Ownership: 84%
Institutional Transaction Last 3 Months: 3%
Measured Target: 325

$ALB Short IdeaALB big gap up before ER has me suspect... also technically it looks like FEB price action is still in a downward channel, and now there is a juicy gap below :)
I like the R/R on a short before ER's move.
Small size, picked up a few puts. Can also do bear spreads for less risk exposure.

$ALB#$ALB
At last yesterday broke the right shoulder high. And closed above too.
Today i will start a small position hopefully or on Monday depending on open today.
$ALB Getting BetterCheck my post on $ALB from last week.
This gotten better with the action last week.
Very nice head and shoulders bottom base on this one.

HigherPrice held long term up trend support and also broke the short term down trend! It should probably go back to test the previous high over the next few weeks/months ! Just my opiniom

5/18/22 ALBAlbemarle Corporation ( NYSE:ALB )
Sector: Process Industries (Chemicals: Specialty)
Market Capitalization: $27.636B
Current Price: $235.98
Breakout price: $243.05
Buy Zone (Top/Bottom Range): $231.20-$210.80
Price Target: $263.40-$265.50 (1st), $288.00-$291.50 (2nd)
Estimated Duration to Target: 86-90d (1st), 159-166d (2nd)
Contract of Interest: $ALB 9/16/22 250c, $ALB 12/16/22
Trade price as of publish date: $22.20/contract, $31.05/contract

$ALB Head and Shoulders Bottom$ALB looking like its rounding up the right side of its base while the market is making new lows.
Characteristics of TMLs.
Starting to look like a head and shoulders bottom. Just need to tighten up below that supply line.
Worthy of your watchlist.

Albemarle - Swing trade opportunityToday, an opening gap appeared on the daily chart of Albemarle; as a result, this offers an opportunity for a simple trade setup. We are currently bearish on Albemarle and expect a complete retracement of the opening gap. Therefore, we would like to set a price target for Alb at 198.44 USD.
Illustration 1.01
Albemarle opened up almost 7%.
Technical analysis - daily time frame
RSI and Stochastic turned bullish. DM+ and DM- performed bullish crossover. However, we think these are false bullish signals. We conclude this from a low ADX value. The daily time frame is deceptive.
Illustration 1.02
The picture above shows the short-trade setup.
Technical analysis - weekly time frame
RSI, MACD, and Stochastic are all bearish. DM+ and DM- perform whipsaws, and ADX contains a low value. That indicates the presence of a very weak trend. Overall, the weekly time frame is bearish.
Please feel free to express your ideas and thoughts in the comment section.
DISCLAIMER: This analysis is not intended to encourage any buying or selling of any particular securities. Furthermore, it should not serve as a basis for taking any trade action by an individual investor. Therefore, your own due diligence is highly advised before entering a trade.

Lower!Price is now pushing down towards the 160 area level ! If you believe in the electric revolution, Albermale has a great potential due to its Lithium production (electric Batteries)! But just be patient and let the market come to you ! Just my opinion:)

Long ALB Corp.Long ALB at $203.75.
Bought some ALB shares when i opened up the chart today and saw it corrected down around 17%. Kind of knee-jerk reaction. I'm down after close today. Looking for a bounce at open or will ditch the play.
