Trade ideas

Look To Short Albemarle (ALB) Stock If Price Falls Below 215CAPITALCOM:ALBES
Daily Timeframe Position
Albemarle (ALB) may be nearing the end of its uptrend since late March 2020. A long-term Trend Line from the valley in March moves upward against corresponding valleys signifying the uptrend (weekly timeframe). For the first time price has now dropped and closed below the trendline. Although it has closed below the Trend Line, and that may signal that it is not in an uptrend anymore, we have not yet confirmed that it is in a downtrend. To decipher this, we use the 1-2-3 trend change method.
1 - This is where the price has closed below the trendline
2 - There is a retracement and a retest of the high that fails
3 - A close below the closest valley to the breakout (However, this has not happened yet). If the price pushes past 215 and closes, then this is another signal that a downtrend is impending
Another short signal is the Double Top that has formed, which is compounded by strong selling (as you can see by the long shadows of the candles at the price range of 244). This Double Top has also been confirmed as we have a close below the valley between the two peaks (shown with the white dot).
Yet another signal is the Fibonacci retracement that shows a pullback at 50%.
We can see that price is hovering at a number of Support regions, including a Descending Triangle and Support at 215, which incidentally is also a round number. There is also Support Line formed for 215 from a smaller descending triangle to the left between September and October.
If the price breaks 215, we can most probably expect a sharp drop until resistance is reached at 185 provided by the Support line of the Broadening Formation. 185 is also coincidentally 15% away from the breakout price.
Placing your entry at 214 (past Support at 215) and taking profits at 185 will give you a 5.5 to 1, which is not bad at all. This is only if you place your stop relatively close to the Support that is keeping this price afloat, say at approximately 216/17. Consider taking profits rather at 194 just before the tiny bit of price congestion that appears in that Broadening Formation to the left. Price will most probably stall here and start to retrace, but you will be guaranteed a 3.5 to 1 . If done correctly, you can get out at this point, wait for the Fibonacci retracement at 62%, and short again if you see price is dropping further. If you are thinking of riding the downtrend, then placing your Stop loss at the 62% retracement from the valley peak when it starts to retrace is your best bet.

ALB LOOKs like a good buyAlbemarle Corporation is a fine chemical manufacturing company based in Charlotte, North Carolina. It operates 3 divisions: lithium, bromine specialties and catalysts
LOOKs like a good buy
just follow the signs
Albemarle Corporation Showing Signs Of StrengthIf price touches 220 again with rejection, this could be a starting point for another rally to the upside
N.B
- Let emotions and sentiments work for you
-ALWAYS Use Proper Risk Management In Your Trades

ALB Short in Short Term, Long in Long TermWatch for downward cross of moving averages, price finds support at the bottom of the channel and continues to rise from there.
Company is experiencing short term weakness along with broad sectors of the US Economy.
Market has been falling on news of new variant. General skittishness paired with portfolios rebalancing for 2021 year end make for extra selling pressure.
Albemarle will benefit from the strong tailwinds of rising commodity prices and increased demand for the elements they mine.

ALB - Albermarle CorporationNYSE:ALB
Idea is simple:
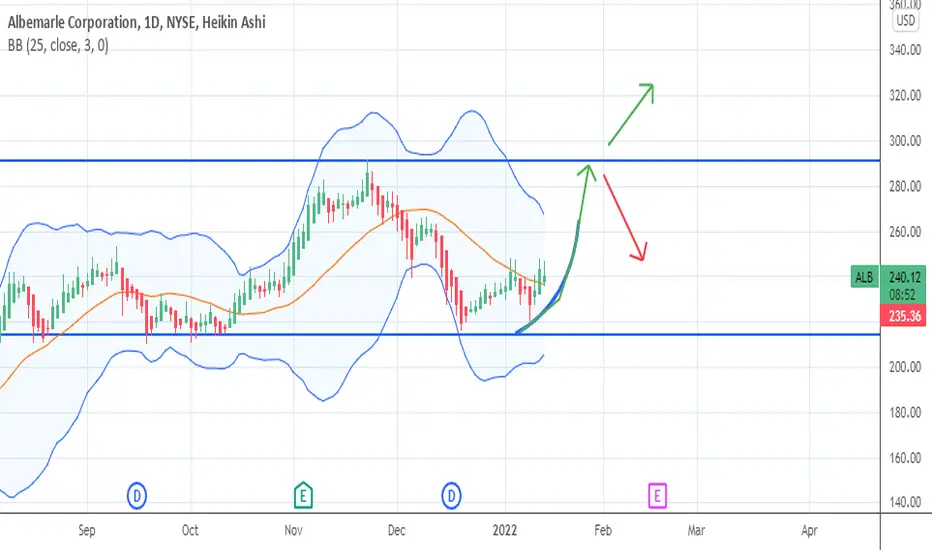
Long position when the price breaks out of flag and closes 1h or 4h higher than ($283)
Stop - close if the stock closes 1d lower than $283
Take - if it goes higher, place stop at $283 and watch the show
Feel free to comment / add a feedback

Bullish Sentiment This has been on a steady roll for over a year - heading into a Lithium boom in 2022 and 2023.

Albemarle CorporationAlbemarle broke out of a multi month trading range in combination with a high volume

Lit Knife Catching at the end of 2019Lithium is the future, watch this baby rip once the Republicans get booted in 2020 vote

10/31/21 ALBAlbemarle Corporation ( NYSE:ALB )
Sector: Process Industries (Chemicals: Specialty)
Current Price: $250.51
Breakout price trigger: $252.00
Buy Zone (Top/Bottom Range): $242.00-$230.00
Price Target: $276.00-$279.00 (2nd)
Estimated Duration to Target: 19-22d (2nd)
Contract of Interest: $ALB 12/17/21 290c
Trade price as of publish date: $3.50/contract

ALB - Daily Buy SetupNice buy setup for about 2.5:1
Trigger $235.81
Entry: $235.81+
Target $253.00
Stop loss: $229.20

ALB.I think long term, we are going to dump. Just a matter of setting up the move down now. This could be the spot. I am taking the short because it is an easy stoploss above previous all time highs.

Albermale Corp, Head & Shoulder PlayALB has been carving out a potentially bearish Head & Shoulders top. Look for a close through the neckline at 210 to deploy short positions targeting a test of the measured move objective at 168.2

ALB for kicks and gigglesHere's a fun trade, ALB puts for tomorrow. If you think LIT is heading down tomorrow...
Damn stock moves a lot, can be a big winner, all or nothing trade.

ALB target price 227$ +30%Sector rotation to non-tech stocks is visible. It is recommended to increase cash within 2-3 months. Finance, dividends, value stocks, and blue-chip stocks should be gradually increased. ALB seems to flow well. A company that works like a cow.

ALB Close to a breakout7 Month long ascending triangle
Volume picking up
Decent uptrend
Earnings coming up
Pays out dividend as well
ALB - VCP consolidation Very tight price action before BO last Friday (9-Jul-21)
“Success isn't just about what you accomplish in your life; it's about what you inspire others to do.” One thing that is certain about success is it's rarely (if ever) accomplished alone!

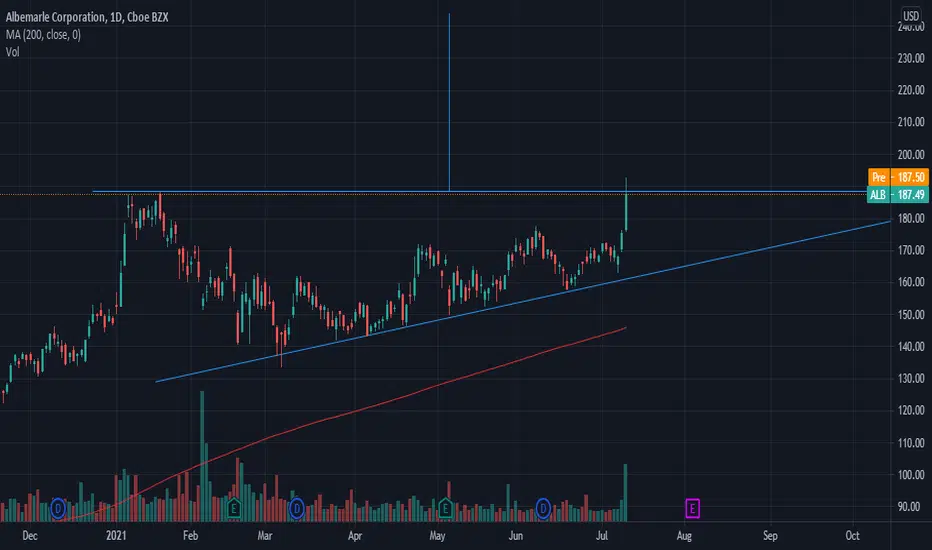
$ALB - Could retest 187 to form a CUPALB is in uptrend. If it hits, 187 it could form a CUP.
Target - 187
———————————————————
How to read my charts?
- Matching color trend lines shows the pattern. Sometimes a chart can have multiple patterns. Each pattern will have matching color trend lines.
- The yellow horizontal lines shows support and resistance areas.
- Fib lines also shows support and resistance areas.
- The dotted white lines shows price projection for breakout or breakdown target.
Disclaimer: Do your own DD. Not an investment advice.

Technical analysis update: ALB (27th May 2021)ALB broke out of its triangle pattern. It prierced above upper bound which is bullish sign. RSI, MACD and Stochastics are also bullish. Our short term price target is 180 USD per share. Our medium price target is 200 USD per share.
Disclaimer: This analysis is not intended to encourage buying or selling of any particular securities. Furthermore, it should not serve as basis for taking any trade action by individual investor. Your own due dilligence is highly advised before entering trade.

Albermale should be go upAlbermale stabilied on the MA200 (4h or MA100 day) so the upward trend should continue now.

Albermale is still fightig to stay in upward trendHolding my ALB position right now, but it's fighting really hard with the upward trend.
Direction is right now still questionable, but stil holding...

stagflation play #1forming a new thesis post jobs report & current inflation metrics: I think this economy and most of the world goes into a period of stagflation. Metals mining, hard assets, some chemicals will do okay. The modern version of this will be companies that get off internal combustion. Short in the near term, long after this latest market shakeout.

