figma bullwe have had over a 60% drop in fig. its go time now or never for fig.i see a triple bottom with support at 50.00 target level 65.00
Next report date
—
Report period
—
EPS estimate
—
Revenue estimate
—
−1.7101 EUR
−707.21 M EUR
723.53 M EUR
171.02 M
About FIGMA INC
Sector
Industry
CEO
Dylan Field
Website
Headquarters
San Francisco
Founded
2012
ISIN
US3168411052
Figma, Inc. is an AI-powered design platform that enables seamless collaboration across the entire product development lifecycle. Its products include FigJam, Figma Slides, Figma Design, Figma Draw, Dev Mode, Figma Sites, Figma Buzz and Figma Make. The company was founded by Dylan Joseph Field and Evan Darrow Wallace in 2012 and is headquartered in San Francisco, CA.
Related stocks

Slow accumulation - Slow & Steady wins the RaceI like this below $58, but that doesn't make it an optimal entry, below $40 is what i'm after. This is an expensive stock by all valuation metrics. 69x Price to Sales. It wouldn't be right to look at P/E but it's at 1754, sounds like a bad joke, right?
But let's look at it another way. Q2 Revenue i

Long Setup — FIG (130m)🎯 Strategy Overview
We’re positioning long from the retracement zone between $59.65 – $49.52, aligning with Fibonacci retracement levels and anchored VWAP support.
⚙️ Trade Plan
We’ll execute this setup in two steps to scale into strength.
🟩 Trade #1
Entry: $53.50
Stop: Below $49.52
Target: $58.

FIGma inc - time to invest If you like the idea, please put a ‘like’. It's the best ‘Thank you!’ 😊 P.S. Always do your own analysis before a trade. Set a stop loss. Capture profits in instalments. Withdraw profits in fiat and make yourself and your friends happy.

FIG to close the gap at $65Everything lines up. We're at resistance, right now. Fibs look good, trendlines look good, and volume looks good. looking for 12% up from here.

Figma Chart Fibonacci Analysis 092525Trading Idea
1) Find a FIBO slingshot
2) Check FIBO 61.80% level
3) Entry Point > 54.4/61.80%
Chart time frame:B
A) 15 min(1W-3M)
B) 1 hr(3M-6M)
C) 4 hr(6M-1year)
D) 1 day(1-3years)
Stock progress:A
A) Keep rising over 61.80% resistance
B) 61.80% resistance
C) 61.80% support
D) Hit the bottom
E
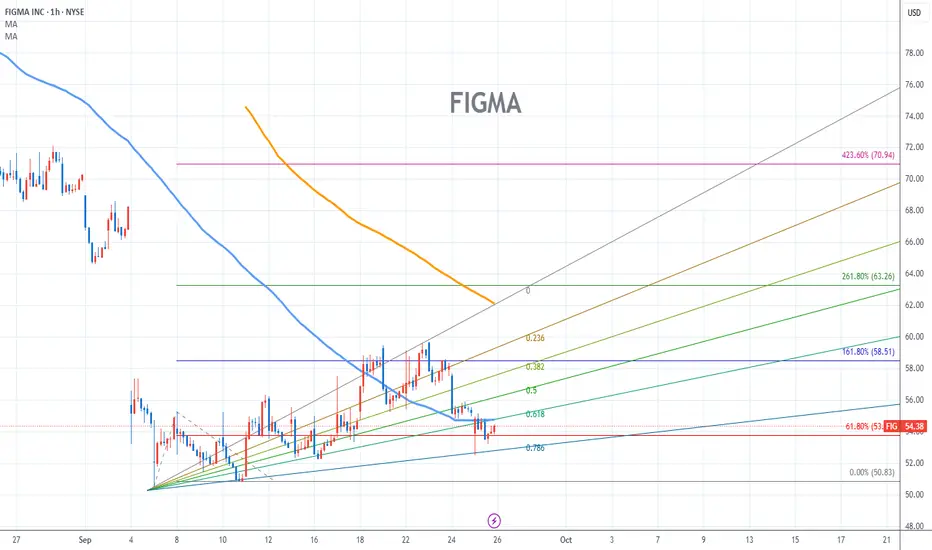
FIG (Figma) — Trade Plan
I’m watching Figma because:
* It had strong volume before the market opened, which usually means something’s coming.
* It has enough range (movement) to make a trade worth it today.
---
Big Picture View (Higher Timeframes)
* On the 6-hour chart, price broke below an important trendline. That co

Figma Wave 5 Sell-Off or Bullish Breakout Incoming?High-Probability Setup in Motion, Eyes on the Drop Zone! Figma’s recent price action confirms a developing 5-wave corrective structure, currently deep in the wave 3 leg within a descending channel. The structure remains valid while price stays below the descending trendline, which has consistently a

Is it Asana 2.0?- Similar to NYSE:ASAN , NYSE:FIG has a good product, customer friendly, good UI/UX, easy to use.
- Valuation is out whack because IPO frenzy
- Things I like is their growth which 40%+ yoy but my concern is that the technical addressable market isn't huge for design space in general.
- Their
FIGMA Earnings BEAR PLAY--Put $63 for 200%+?
## ⚠️ FIG Earnings Bear Play 🚨 | High Risk 💣 High Reward 🎯 (2025-09-03)
📉 **Thesis:** FIG has strong revenue growth but *massive losses + heavy leverage*. Options flow shows **huge put OI at \$60** → market leaning bearish. Stock at **52-week lows** with weak momentum.
📊 **Trade Setup (Weekly Ear

See all ideas
Summarizing what the indicators are suggesting.
Neutral
SellBuy
Strong sellStrong buy
Strong sellSellNeutralBuyStrong buy
Neutral
SellBuy
Strong sellStrong buy
Strong sellSellNeutralBuyStrong buy
Neutral
SellBuy
Strong sellStrong buy
Strong sellSellNeutralBuyStrong buy
An aggregate view of professional's ratings.
Neutral
SellBuy
Strong sellStrong buy
Strong sellSellNeutralBuyStrong buy
Neutral
SellBuy
Strong sellStrong buy
Strong sellSellNeutralBuyStrong buy
Neutral
SellBuy
Strong sellStrong buy
Strong sellSellNeutralBuyStrong buy
Frequently Asked Questions
The current price of A41DRC is 33.4000 EUR — it has increased by 3.73% in the past 24 hours. Watch Figma, Inc. Class A stock price performance more closely on the chart.
Depending on the exchange, the stock ticker may vary. For instance, on LSX exchange Figma, Inc. Class A stocks are traded under the ticker A41DRC.
A41DRC stock has risen by 6.37% compared to the previous week, the month change is a −19.32% fall, over the last year Figma, Inc. Class A has showed a −73.40% decrease.
We've gathered analysts' opinions on Figma, Inc. Class A future price: according to them, A41DRC price has a max estimate of 60.45 EUR and a min estimate of 44.91 EUR. Watch A41DRC chart and read a more detailed Figma, Inc. Class A stock forecast: see what analysts think of Figma, Inc. Class A and suggest that you do with its stocks.
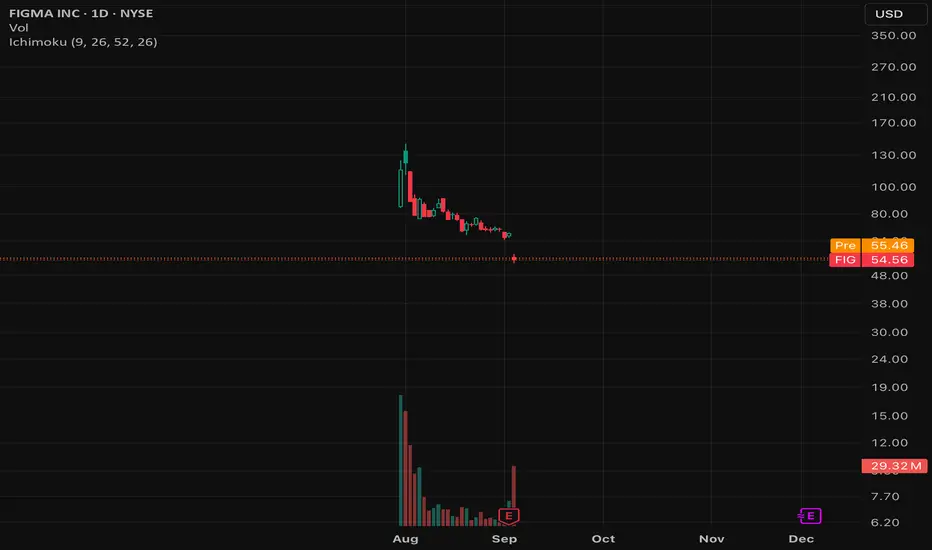
A41DRC reached its all-time high on Aug 1, 2025 with the price of 130.4600 EUR, and its all-time low was 28.6000 EUR and was reached on Nov 21, 2025. View more price dynamics on A41DRC chart.
See other stocks reaching their highest and lowest prices.
See other stocks reaching their highest and lowest prices.
A41DRC stock is 0.00% volatile and has beta coefficient of −0.89. Track Figma, Inc. Class A stock price on the chart and check out the list of the most volatile stocks — is Figma, Inc. Class A there?
Today Figma, Inc. Class A has the market capitalization of 15.91 B, it has increased by 0.72% over the last week.
Yes, you can track Figma, Inc. Class A financials in yearly and quarterly reports right on TradingView.
Figma, Inc. Class A is going to release the next earnings report on Mar 18, 2026. Keep track of upcoming events with our Earnings Calendar.
A41DRC earnings for the last quarter are 0.09 EUR per share, whereas the estimation was 0.04 EUR resulting in a 119.51% surprise. The estimated earnings for the next quarter are 0.06 EUR per share. See more details about Figma, Inc. Class A earnings.
Figma, Inc. Class A revenue for the last quarter amounts to 233.65 M EUR, despite the estimated figure of 224.93 M EUR. In the next quarter, revenue is expected to reach 251.69 M EUR.
A41DRC net income for the last quarter is −934.87 M EUR, while the quarter before that showed 718.17 K EUR of net income which accounts for −130.27 K% change. Track more Figma, Inc. Class A financial stats to get the full picture.
No, A41DRC doesn't pay any dividends to its shareholders. But don't worry, we've prepared a list of high-dividend stocks for you.
As of Dec 5, 2025, the company has 1.58 K employees. See our rating of the largest employees — is Figma, Inc. Class A on this list?
EBITDA measures a company's operating performance, its growth signifies an improvement in the efficiency of a company. Figma, Inc. Class A EBITDA is −879.60 M EUR, and current EBITDA margin is −116.12%. See more stats in Figma, Inc. Class A financial statements.
Like other stocks, A41DRC shares are traded on stock exchanges, e.g. Nasdaq, Nyse, Euronext, and the easiest way to buy them is through an online stock broker. To do this, you need to open an account and follow a broker's procedures, then start trading. You can trade Figma, Inc. Class A stock right from TradingView charts — choose your broker and connect to your account.