LTCUSD taking flight to 515, all boarding completeLTCUSD just completing its last boarding point for under 90’s. It just entered its last turn to complete inverted head and shoulders pattern with volume. The next hop is at 95 to 98 before it takes its journey towards 515. Have a safe flight ✈️ 🚀🚀🚀🚀🚀🚀🚀✈️
** Invest with caution, this is just my an

$LTC: The Best Positioned AltcoinTo all those who doubted XRP's breakout in November 2024, history is repeating and LTC will be the beneficiary.


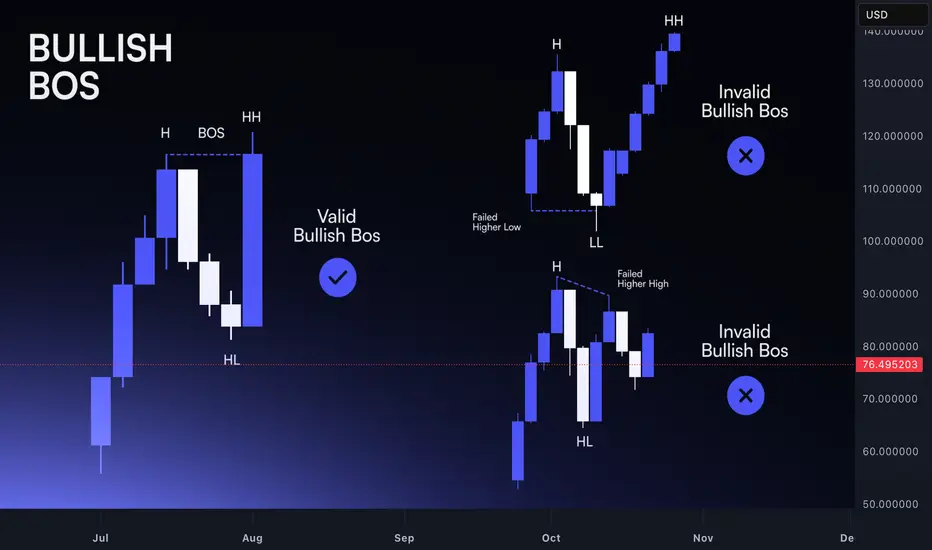
Break of Structure: Identifying Real Trend Shifts Markets move in phases, and structure is the clearest way to read those transitions. A trend doesn’t reverse because price slows down or because a candle looks different. It reverses when the underlying pattern of highs and lows breaks.
Understanding this sequence is what separates disciplined anal
Litecoin's XRP-like breakout - 4 digitsIf you overlay XRP's 2024 breakout fractal on top Litecoin's current price action, it's nearly a perfect fit.
With new business cycle, dovish Fed stance acting as tailwinds (QE and rate cuts) as well as other regulatory and market access (CLARITY Act, Index ETFs, etc.), whenever Litecoin decides to

LITECOIN can easily hit $43 in the next 10 months.Litecoin (LTCUSD) started its new Bear Cycle after a rejection on the 4-year Lower Highs trend-line. Now that it sits below its 1W MA200 (orange trend-line), which was formally a Resistance during the Bull Cycle, we can claim that the next stage should be targeting the Higher Lows 1 trend-line.
Giv

$LTC Bullish ScenarioLitecoin might be starting a bullish 5 waves to the upside
This is a possible EW counting, combined with the Litecoin Rainbow Chart indicator
Crypto Lama

LITECOIN / NEW AGE LTC Target: +$500 (more)LTC is loading... ⏳ Target: $500+ Timeframe: 2026
🚨 LITECOIN (LTC) MACRO UPDATE: The Sleeping Giant Wakes 🚨
Ladies and gentlemen, the chart speaks for itself. We are looking at one of the most pristine Ascending Parallel Channels in crypto history.
We are currently sitting at a "make or break" gen

LTCUSD has formed a potential head and shoulders bottom patternOn the 4-hour chart, LTCUSD has formed a potential head and shoulders bottom pattern. Currently, watch for support around 79.6; a pullback that holds above this level could lead to further upward movement. Resistance is seen around 87.7, with a break above this level targeting the 94.2-97.5 area.

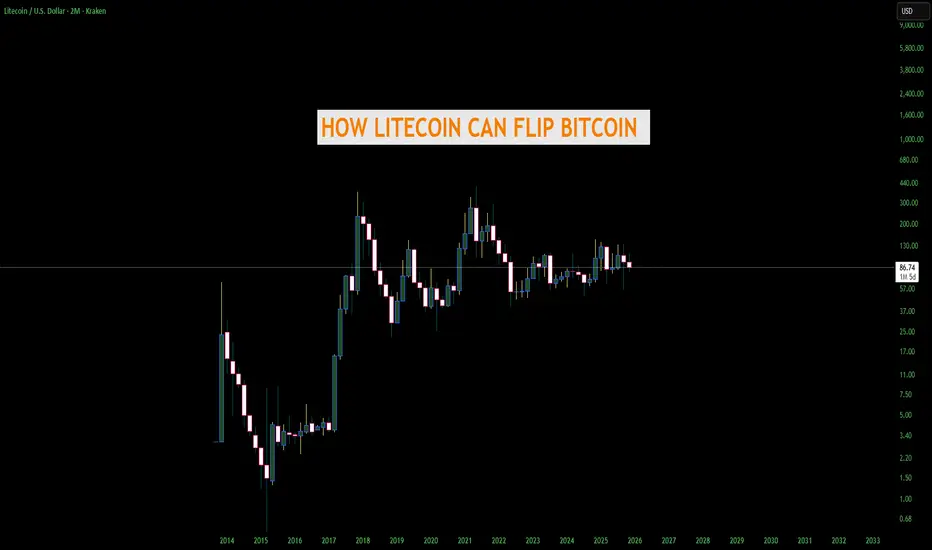
THE DAY LITECOIN FLIPS BITCOIN AND BECOMES #1 - AND HOWGrok helped me with this but regardless this is a great read. Not financial advice
1. Bitcoin fees explode again (> $50–$200 per transaction)
LTC stays under 5¢ and 4× faster → merchants & users flee to “digital silver” for actual payments
-Historical precedent: May 2017 & Dec 2017 fee madness
See all ideas
Summarizing what the indicators are suggesting.
Oscillators
Neutral
SellBuy
Strong sellStrong buy
Strong sellSellNeutralBuyStrong buy
Oscillators
Neutral
SellBuy
Strong sellStrong buy
Strong sellSellNeutralBuyStrong buy
Summary
Neutral
SellBuy
Strong sellStrong buy
Strong sellSellNeutralBuyStrong buy
Summary
Neutral
SellBuy
Strong sellStrong buy
Strong sellSellNeutralBuyStrong buy
Summary
Neutral
SellBuy
Strong sellStrong buy
Strong sellSellNeutralBuyStrong buy
Moving Averages
Neutral
SellBuy
Strong sellStrong buy
Strong sellSellNeutralBuyStrong buy
Moving Averages
Neutral
SellBuy
Strong sellStrong buy
Strong sellSellNeutralBuyStrong buy
Displays a symbol's price movements over previous years to identify recurring trends.
Curated watchlists where LTCUSD.P is featured.

Gen 1 crypto: from little acorns grow
15 No. of Symbols

Proof of Work: Embracing the crunch
27 No. of Symbols

Top altcoins: Choose your alternatives carefully
28 No. of Symbols
See all sparks