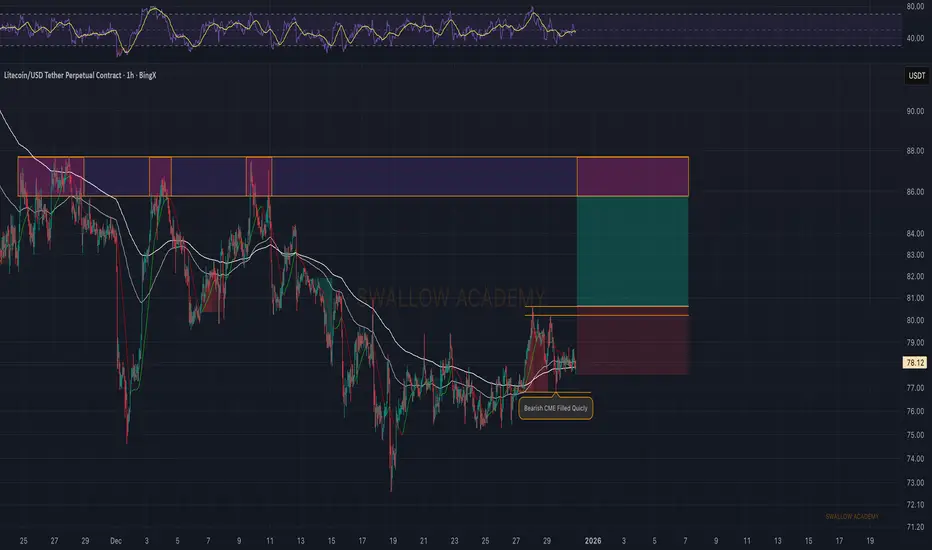
Litecoin (LTC): Going With Easy & Proven Strategy Here | BullishLTC is setting up a very clean and simple idea here. Price has been ranging under the same local resistance for some time, and this level has been rejected multiple times already. We recently had a bearish CME formed, sellers pushed into it, but that area was filled very quickly and buyers stepped i
Related pairs
LTCUSDT - Retest of the liquidity zone on a downtrendBINANCE:LTCUSDT.P is forming a local rally after breaking through resistance at 78.0. The market is bearish, but within the bullish run, the altcoin may test liquidity at 79.4 - 81.0.
Bitcoin looks weak, a rebound from resistance is forming, and Friday's daily bar indicates strong bearish domi

LTC/USDT | Up or down? (READ THE CAPTION)By examining the 2H chart of LTCUSDT, we can see that after sweeping initial SellSide Liquidity, it started an upwards move, currently being traded at 77.55.
There are relative equal lows below the current zone LTCUSDT is being traded, I expect it to eventually drop there and sweep the liquidity the

LTCUSDT Bullish Structure – Is This the Next Expansion Leg?📊 LTC/USDT "DIGITAL SILVER" BULLISH BREAKOUT 🚀 | Swing Trade Profit Setup
🎯 TRADE OVERVIEW
Asset: Litecoin vs Tether (LTC/USDT)
Timeframe: 4H / Daily
Current Price: $77.32 USDT
Strategy Type: Swing Trade (Bullish Recovery)
Market Condition: Oversold with Bullish Divergence ⚡
Fear & Greed Index: 21

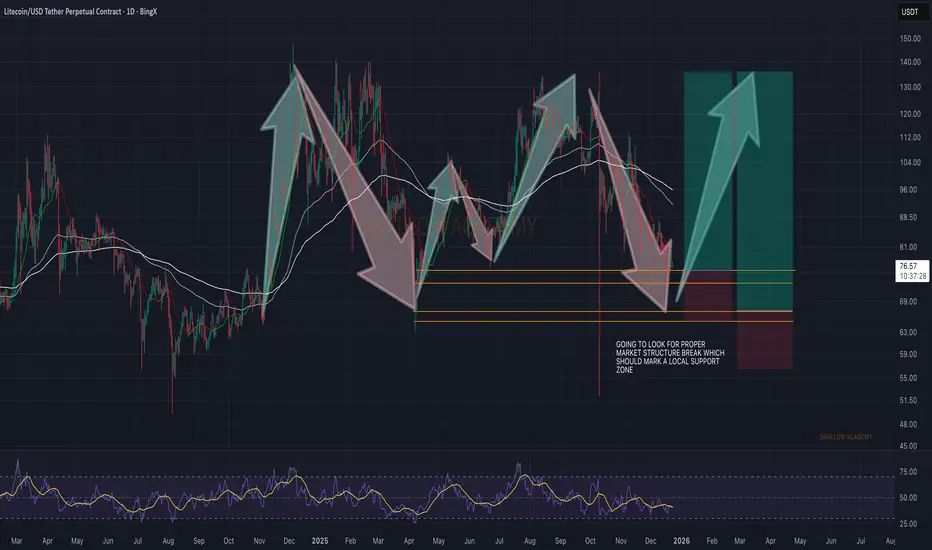
Litecoin (LTC): Looking For Market Structure Break | Bullish AFLTC has been moving in a clear up–down sequence with strong impulsive moves on both sides. Right now we’re coming from a downtrend, and the focus is on seeing a proper MSB form, which would mark a local support zone.
Once that MSB appears and buyers step in with control, this would signal a potenti
LTC / USDT Potential Reversal From Strong Support ZoneNYSE:LTC continues to trade within a medium term downtrend, however price is currently holding above a strong support zone around 74 to 76 USDT.
This area has shown multiple reactions and is acting as an accumulation base.
If price manages to hold this support and break above the descending tren

LTC/USDT | Retesting incoming (READ THE CAPTION)As you can see in the 2h chart of LTCUSDT, it made it out of the FVG last night and gone up as high as 84.57, sweeping the BSL there, but it returned to the FVG and it is now being traded at 83.10. I expect Litecoin to to retest the high of the FVG again and then go on to sweep the liquidity above t

LTCUSDTEntry:82.70_83.44
Sl:83.73
Tp:81
**Please observe capital management. There is no responsibility for your profits or losses.**

ltc scalp short to $80.91 areaHopped into this scalp short a while ago on ltc.
Roughly 2rr.
Tp: $80.91 . Anticipating daily correction down before continuation

LTC/USDT | Will it continue to go higher? (READ THE CAPTION)As you can see in the 2H chart of LTCUSDT, it got in the FVG zone, but failed to stay there and it is now below the low of the FVG, being traded at 82.10.
I don't expect it to go lower, rather want it to go and retest the FVG zone and maybe even breaking through it.
Should it fail to go higher and

See all ideas
Summarizing what the indicators are suggesting.
Oscillators
Neutral
SellBuy
Strong sellStrong buy
Strong sellSellNeutralBuyStrong buy
Oscillators
Neutral
SellBuy
Strong sellStrong buy
Strong sellSellNeutralBuyStrong buy
Summary
Neutral
SellBuy
Strong sellStrong buy
Strong sellSellNeutralBuyStrong buy
Summary
Neutral
SellBuy
Strong sellStrong buy
Strong sellSellNeutralBuyStrong buy
Summary
Neutral
SellBuy
Strong sellStrong buy
Strong sellSellNeutralBuyStrong buy
Moving Averages
Neutral
SellBuy
Strong sellStrong buy
Strong sellSellNeutralBuyStrong buy
Moving Averages
Neutral
SellBuy
Strong sellStrong buy
Strong sellSellNeutralBuyStrong buy
Displays a symbol's price movements over previous years to identify recurring trends.
Frequently Asked Questions
The current price of Litecoin / UST (LTC) is 83.08700000 USDT — it has risen 2.28% in the past 24 hours. Try placing this info into the context by checking out what coins are also gaining and losing at the moment and seeing LTC price chart.
Litecoin / UST price has risen by 7.11% over the last week, its month performance shows a 4.88% increase, and as for the last year, Litecoin / UST has decreased by −27.91%. See more dynamics on LTC price chart.
Keep track of coins' changes with our Crypto Coins Heatmap.
Keep track of coins' changes with our Crypto Coins Heatmap.
Litecoin / UST (LTC) reached its highest price on May 10, 2021 — it amounted to 412.39000000 USDT. Find more insights on the LTC price chart.
See the list of crypto gainers and choose what best fits your strategy.
See the list of crypto gainers and choose what best fits your strategy.
Litecoin / UST (LTC) reached the lowest price of 24.12000000 USDT on Mar 13, 2020. View more Litecoin / UST dynamics on the price chart.
See the list of crypto losers to find unexpected opportunities.
See the list of crypto losers to find unexpected opportunities.
The safest choice when buying LTC is to go to a well-known crypto exchange. Some of the popular names are Binance, Coinbase, Kraken. But you'll have to find a reliable broker and create an account first. You can trade LTC right from TradingView charts — just choose a broker and connect to your account.
Crypto markets are famous for their volatility, so one should study all the available stats before adding crypto assets to their portfolio. Very often it's technical analysis that comes in handy. We prepared technical ratings for Litecoin / UST (LTC): today its technical analysis shows the sell signal, and according to the 1 week rating LTC shows the sell signal. And you'd better dig deeper and study 1 month rating too — it's sell. Find inspiration in Litecoin / UST trading ideas and keep track of what's moving crypto markets with our crypto news feed.
Litecoin / UST (LTC) is just as reliable as any other crypto asset — this corner of the world market is highly volatile. Today, for instance, Litecoin / UST is estimated as 1.49% volatile. The only thing it means is that you must prepare and examine all available information before making a decision. And if you're not sure about Litecoin / UST, you can find more inspiration in our curated watchlists.
You can discuss Litecoin / UST (LTC) with other users in our public chats, Minds or in the comments to Ideas.