LTC - GREAT Potential : ALT for 2026Hello Traders 📈
LTC / Litecoin may still present great opportunities for 2026.
From a bigger perspective, it may seem like LTC doesn't move much. But if we zoom in, we see massive bounces over the course of 3-4 weeks which presents big opportunities if you can buy in low:
From a technical indicator perspective, in the 4h LTC is still trading UNDER< showing that bears are still in control:
In the daily, we still see the same story however there seems to be a bullish W pattern appearing. As soon as the price reclaims the MA in the DAILY timeframe , that would be the first positive indicator of more upside:
For the short term, we need to see LTC trade ABOVE ALL the 4h moving averages in order to begin anticipating a bigger move up.
Trade ideas

LTC close to support area more gain expected 22% gain to 121$Hi the support and resistances on the chart are based on the previous data and weekly candlesticks if BINANCE:LTCUSDT holds this last support the potential of 22% gain is logical toward 121$

LTC/USDT | LTC Holding Steady Above $76 – Bulls Eye $136!By analyzing the #Litecoin chart on the weekly timeframe, we can see that after correcting to $79, the price has started to rise again and is now trading around $88.5.
If Litecoin manages to stay above $76, we can expect further upside momentum. The next potential targets are $97, $106, $118, and $136.
Please support me with your likes and comments to motivate me to share more analysis with you and share your opinion about the possible trend of this chart with me !
Best Regards , Arman Shaban

LTCUSDT Idea | Bearish Optimism in the MarketHi there,
Let's take a look at LTCUSDT. It appears bearish on the Daily timeframe, with the significant resistance at 100.00. The next meaningful support levels are 80.19 and 67.75. It is possible that the price will fall even more to the range of 50.35 to 28.83.
Because of that strong red lower wick, watch sentiment and related news; it will be necessary to monitor price changes. Consider your risk tolerance, as market volatility can potentially lead to large losses.
Happy Trading,
K.
__
This analysis employs custom mathematical theories and patterns; it is not financial advice

Litecoin (LTCUSDT) – Smart Money Accumulation and Liquidity HuntLitecoin has entered a decisive re-accumulation phase after a prolonged period of liquidity manipulation and structural compression. The market structure clearly reflects controlled accumulation by larger entities preparing for a directional expansion.
1. Accumulation & Side-line Manipulation
Following the sharp capitulation event labeled “Trump nukes the market”, price action transitioned into an extended accumulation range. This was a classic liquidity engineering phase, where market makers ran both sides of the book to trap breakout traders and absorb liquidity at discounted prices.
The extended sideways movement was not weakness, but preparation — smart money quietly positioning while the broader market focused on Bitcoin and ETF headlines.
2. Re-Manipulation and Entry Confirmation
The re-manipulation phase has been completed, with price now consolidating above the structural support near $98.00.
I have personally entered a long position at $98.10, aligning with the Smart Money entry zone ($98.00 - $99.00).
The area represents efficient price delivery where institutional accumulation meets retail confusion — a classic setup before expansion.
The recent ETF-driven sentiment acts as the perfect catalyst for volatility absorption before the impulsive move higher. Smart money often enters during such quiet, technically uncertain zones, not during euphoria.
3. Liquidity Objectives
The immediate liquidity target is the untested breaker zone near $126 - $127, where a prior high remains unswept.
My first take-profit zone (TP1) is at $135 - $140, aligning with the previous high liquidity cluster.
If momentum replicates recent Zcash-style vertical behavior, Litecoin could deliver a legendary move toward the $580 - $600 range — its historical distribution top from the previous cycle.
4. Market Maker Structure
The chart currently reflects the three classic stages of market maker behavior:
Phase 1: Accumulation through false breakdowns
Phase 2: Re-manipulation to absorb liquidity on both sides
Phase 3: Expansion toward untouched liquidity pools
Each stage has been structurally respected, confirming the smart money model in play.
5. Macro Confluence & Bitcoin Relationship
Historically, Litecoin tends to top out before Bitcoin, often signaling a macro market top or bear cycle onset within 3 to 5 months.
This pattern has repeated across multiple cycles, making Litecoin’s strength a reliable early indicator of overheated market conditions.
Hence, while the immediate bias remains bullish, I’ll be closely monitoring LTC’s relative strength as a potential macro warning for the broader crypto market.
Key Levels
Entry: 98.10 (Active Long)
Entry Zone: 98.00 – 99.00
Short-term Target: 102.70
Primary Target (TP1): 135 – 140
Extended Target (Cycle High): 580 – 600
Invalidation: Below 94.00
Summary
Litecoin is in the late stages of accumulation, showing signs of smart money re-entry amid a broader risk-on narrative. As long as price remains above 94.00, the path of least resistance remains upward.
Any dips into the 98 region are likely liquidity grabs rather than genuine breakdowns. Buy Spots for a chill trip to 600 with a 6x.
If momentum extends beyond $140 with strong volume expansion, we could be witnessing the start of one of the most aggressive pumps of this cycle.

LTC Trend LineLTC is still holding its long-term trend from 2020. The price is currently accumulating between the $130 resistance and the 2020 trendline support. It continues its path by forming higher highs and higher lows. Once RSI cools down and MACD confirms a breakout, the first target (TP1) can be considered around $280.

LTC DOTConnecting the dot on 1D TIMEFRAME
Just a simple break and retest and a smooth move to the downside
But if we lose that last black line maybe we see 50 or 49
Let's see if we get more downside

LTC USDT LONG SIGNAL---
⚠️ Disclaimer:
This analysis reflects my personal opinion only and is not a financial advice or buy/sell signal.
Please analyze the chart carefully and apply strict risk management before entering any trade.
📢 Signal Alert
🔹 Pair: LTC / USDT
📈 Trade Type: Long
💰 Entry Price: 86.20
🎯 Take-Profit Targets:
TP1 = 88.15
TP2 = 91.51
TP3 = 94.64
🛑 Stop-Loss: 83.85
📊 Timeframe: 1H
⚖️ Risk/Reward Ratio: 3.92
📌 Suggested Leverage: 5x–10x
🔄 After TP1 is reached, move Stop-Loss to Entry to secure profits.
---
🧠 Technical Analysis Explanation:
LTC is showing bullish continuation signals after finding strong demand around the 83.8–85.0 support zone.
The market structure remains bullish, as price continues to print higher lows, confirming strong buying pressure.
The EMA 50 is trending upward, acting as dynamic support, and the RSI has bounced from the 50 zone, reflecting renewed buyer momentum.
Volume data also shows accumulation near the current level, supporting the potential for an upward breakout.
The entry at 86.20 aligns with the recent retest of a short-term breakout area, providing a high-probability setup with favorable risk/reward.
The stop-loss at 83.85 is well-placed below structural support, protecting against false breakouts while maintaining good upside potential.
⚙️ Trade Management Tip:
Wait for a bullish confirmation candle (1H engulfing or rejection wick) before entering.
Take partial profits at TP1, move SL to entry, and trail remaining profits toward TP2–TP3 zones.
---

LTC USDT LONG SIGNAL---
📢 Signal Alert
🔹 Pair: LTC / USDT
📈 Trade Type: Long
💰 Entry Zone: 96.27 – 97.16
🎯 Targets (Take Profits):
TP1 = 98.50
TP2 = 99.70
TP3 = 101.90
🛑 Stop-Loss: 94.80
📊 Timeframe: 1H
⚖️ Risk/Reward Ratio: 2.08
📌 Suggested Leverage: 10x
---
🧠 Technical Analysis Explanation
LTC is currently showing signs of a bullish reversal after bouncing from the 94.8–95.0 support zone.
The price formed a higher low, indicating buyers are stepping back in.
RSI has turned upward from oversold territory, and bullish volume is increasing, indicating growing buying pressure.
The Entry Zone (96.27 – 97.16) sits just above the local support, providing a low-risk, high-reward setup.
Targets are aligned with short-term resistance levels and supply zones.
Stop-Loss is placed at 94.80 to protect against false breakdowns.
⚠️ Note: Confirm entry with a bullish candle close or a minor resistance breakout. Actively manage your position — partial profit-taking is recommended at TP1 and TP2.
-

LTC USDT LONG SIGNAL---
⚠️ Disclaimer:
This analysis represents personal opinion only and is not financial advice. Please analyze the chart yourself before taking any trade and always use proper risk management.
📢 Signal Alert
🔹 Pair: LTC / USDT
📈 Trade Type: Long
💰 Entry: 85.91
🎯 Take-Profit Targets:
TP1 = 87.62
TP2 = 88.91
TP3 = 90.12
🛑 Stop-Loss: 85.10
📊 Timeframe: 1H
⚖️ Risk/Reward Ratio: 5.52
📌 Suggested Leverage: 5x–10x
🔄 After TP1 is hit, move Stop-Loss to Entry to protect profits.
---
🧠 Technical Analysis Summary:
Litecoin (LTC) is showing renewed bullish strength after retesting the 85.00–85.20 support zone, which aligns with a previous demand area and Fib 0.382 retracement. The price has also formed a bullish engulfing candle on the 1H chart, indicating the potential start of a short-term uptrend.
The RSI is crossing above the 50-level, confirming growing buying pressure, while the MACD shows a bullish crossover supporting upward continuation. The target zones (87.6 → 90.1) represent short-term resistance clusters from the recent structure highs.
---
⚙️ Trade Management Tip:
Wait for a clear bullish confirmation candle above 86.00 before entering. Take partial profits at TP1 and trail your stop-loss upward as price moves in your favor to lock in gains.
---

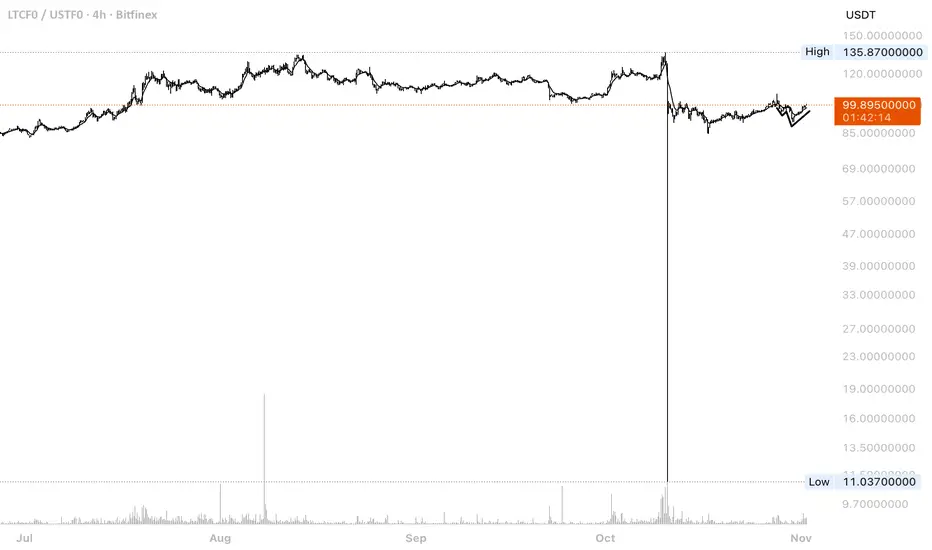
Litecoin on ETF LTCC Approval day... Both sides rekt -10%CRYPTOCAP:LTC started trading today on Wall Street...Guess what!
-10% on the daily, and both sides rekt, shorts and longs.
Litecoin as always, doing what it does best. Wreking people who trades the coin.
Fading every move is the way. No sustainable trends allowed on this coin.
It will have some demand becaise of ETF approval? Who knows, but it will be fun to see TradFi guy trying to trade Litecoin.

LTC USDT LONG SIGNAL---
⚠️ Disclaimer:
This analysis represents personal technical opinion and is not a buy or sell signal.
Please analyze the chart carefully and always use proper risk management before entering any position.
---
📢 Signal Alert
🔹 Pair: LTC / USDT
📈 Trade Type: Long
💰 Entry Price: 81.71
🎯 Take-Profit Targets:
TP1 = 83.75
TP2 = 85.83
TP3 = 89.51
🛑 Stop-Loss: 79.14
📊 Timeframe: 1H
⚖️ Risk/Reward Ratio: 3.38
📌 Suggested Leverage: 5x–10x
🔄 After reaching TP1, move Stop-Loss to Entry to secure profits.
---
🧠 Technical Analysis Summary:
Litecoin (LTC) is showing bullish continuation signals after a clean rebound from the $79–$80 support zone, which has historically acted as a strong demand area.
Price action structure is forming higher lows, indicating renewed buyer strength and a potential shift back into an uptrend.
The RSI has bounced from the 45–50 range, confirming bullish momentum, while volume analysis shows accumulation around the entry zone.
If the price maintains above 81.50, the next bullish leg could target short-term resistances near $83.7 and $85.8, followed by an extended move toward $89.5 if momentum sustains.
The stop-loss at 79.14 is placed strategically below key support and the 50 EMA, ensuring protection against false breakdowns while maintaining a healthy R/R ratio.
⚙️ Trade Management Tip:
Wait for a bullish 1H candle confirmation before entry.
Take partial profits at TP1 and trail SL upward as the price advances toward the higher targets.
---

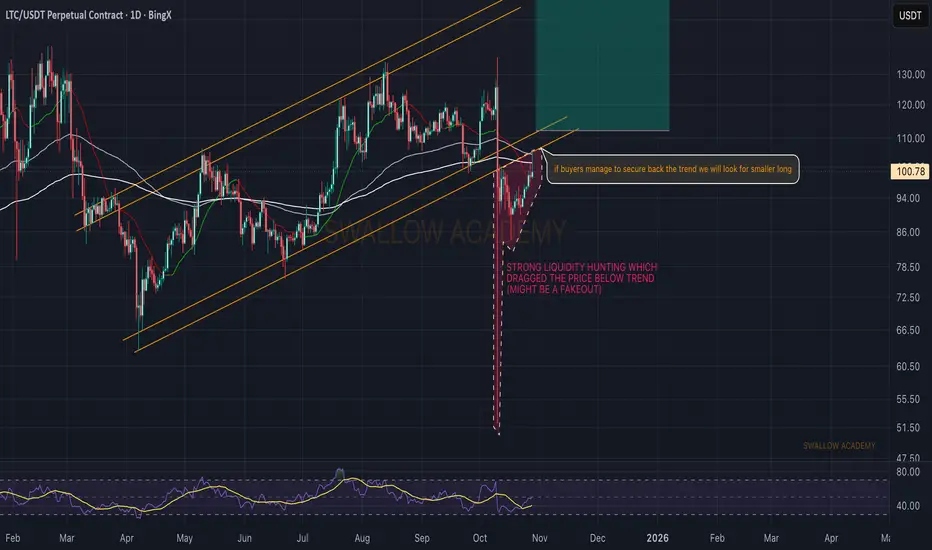
Litecoin (LTC): Waiting For Proper Breakout For Potential Entry!LTC was in a healthy uptrend, which got broken after the recent dip we had. Since then, we’re seeing good signs of recovery, and this move looks more like a fakeout. If buyers manage to get the price back inside the bullish channel, we should see a nice continuation setup forming.
Once buyers reclaim the EMAs as well, it could turn into a really solid long opportunity.
Swallow Academy
LTC : ETFHello friends
Due to the US government shutdown and the Lit coin ETF request that has been raised and is being reviewed, when the government and relevant institutions reopen, it is most likely that the ETF will be approved and expected. Now that the price has corrected and the good decline we had, there is a good opportunity to buy in steps in the specified areas with capital and risk management and move with it to the specified goals.
*Trade safely with us*

LTC: long position!The month of trading proved to be good (LTC).
The general trend shows an increase in prices, with the last buy signal being given in the range of 92-94 USDT, after which the price continued to move up to the current level of about 102.39 USDT

LTC/USDT — Technical Alignment Signals a Fresh Upside Phase!🎭 LTC/USDT: The Market Heist Blueprint | Swing/Day Trade Setup
💰 LITECOIN vs TETHER - Where Opportunity Meets Strategy
📊 THE SETUP
Asset: LTC/USDT (Litecoin/Tether)
Market Approach: Swing/Day Trade Strategy
Trade Style: "Thief Method" - Layered Entry System 🎯
🔍 TECHNICAL CONFIRMATION
✅ Bullish Signal Confirmed:
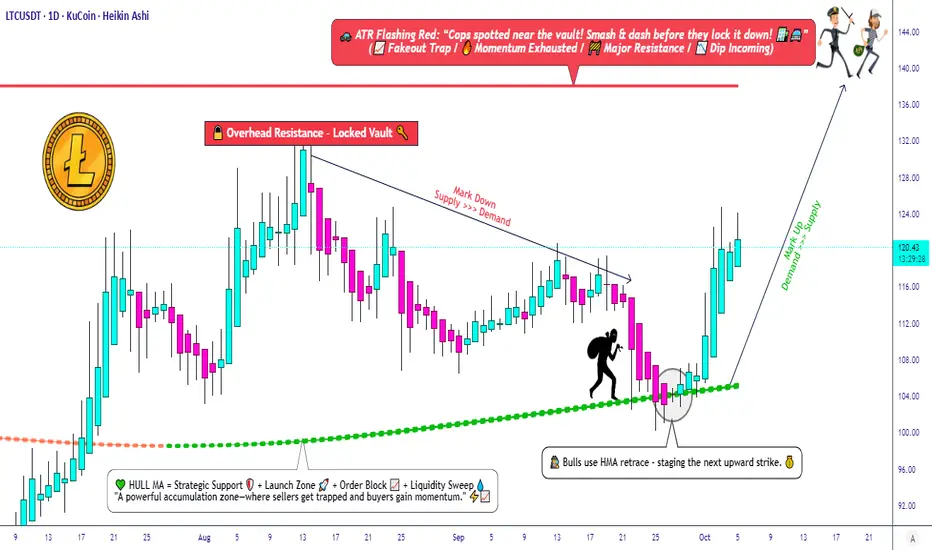
Hull Moving Average showing bullish retracement pattern
Heiken Ashi printing bullish doji candles (classic reversal signal)
Momentum shifting in favor of bulls
The technical confluence is aligning beautifully here, folks. When the HMA retraces and Heiken Ashi doji appears, we're looking at potential momentum shift territory.
🎯 THE THIEF'S ENTRY PLAN
Method: Layered Limit Orders (The "Thief Strategy")
This isn't your typical "one shot, one kill" approach. We're spreading our risk across multiple entry points:
Suggested Layer Entries:
Layer 1: $112
Layer 2: $114
Layer 3: $116
Layer 4: $118
Layer 5: $120
💡 Pro Tip: You can add more layers based on your risk tolerance and position size. The beauty of layering? You average your entry and reduce timing risk. Feel free to enter at any price level within this range.
🛡️ RISK MANAGEMENT
Stop Loss Zone: $108
⚠️ Important Disclaimer: This is MY stop loss level based on my analysis. You are the captain of your own ship! Set your stop loss based on YOUR risk tolerance. This is your money, your rules, your responsibility.
🎪 TARGET & EXIT STRATEGY
Primary Target: $140
Strategic Exit: $138.00
📍 Key Resistance Alert:
Around the $140 level, we've got the ATR line acting like a police barricade 🚔 - expect strong resistance here. This zone typically sees:
Overbought conditions
Potential bull traps
Heavy profit-taking
Exit Philosophy: When the cops show up (resistance hits), it's time for the thieves to exit with the loot! 💰
⚠️ Another Important Note: This target is based on technical analysis, but YOU decide when to take profits. Your account, your choices, your gains. Manage your risk accordingly!
🔗 RELATED PAIRS TO WATCH
Keep an eye on these correlated assets:
Major Crypto Pairs:
BINANCE:BTCUSDT - Bitcoin often leads altcoin movements; LTC tends to follow BTC trends
BINANCE:ETHUSDT - Ethereum correlation provides broader market sentiment
BINANCE:BCHUSDT - Similar payment-focused crypto, often moves in tandem with LTC
LTC Crosses:
BINANCE:LTCBTC - Shows LTC strength relative to Bitcoin
GEMINI:LTCETH - Alternative correlation metric
Key Correlation: When Bitcoin pumps, Litecoin typically follows with amplified moves. Watch BTC dominance for clues on altcoin season intensity.
🎓 KEY TAKEAWAYS
✨ Hull Moving Average retracement + bullish Heiken Ashi = momentum shift
✨ Layered entries reduce timing risk and improve average entry price
✨ ATR-based resistance at $140 = natural profit-taking zone
✨ Multiple stop loss and take profit levels based on individual risk profiles
✨ Correlation with BTC/ETH movements strengthens the setup
⚖️ LEGAL DISCLAIMER
🎭 This analysis uses the "Thief Style" trading strategy as an educational and entertainment concept. This is NOT financial advice. Trading cryptocurrencies carries substantial risk of loss. All entry prices, stop losses, and targets are for educational purposes only.
You are solely responsible for your trading decisions. Past performance does not guarantee future results. Always do your own research and never risk more than you can afford to lose. This is just one trader's perspective shared for fun and community engagement.
🚀 ENGAGE & SUPPORT
✨ If you find value in my analysis, a 👍 and 🚀 boost is much appreciated — it helps me share more setups with the community!
Happy Trading, Thief OG's! 🎩💎
#LTCUSDT #Litecoin #CryptoTrading #TechnicalAnalysis #SwingTrading #DayTrading #HullMovingAverage #HeikinAshi #LayeredEntry #CryptoStrategy #ThiefMethod #RiskManagement #TradingSetup #Altcoins #CryptoSignals
LTCCRYPTOCAP:LTC is building strong structure and consolidating within a long-term range. I’m expecting a breakout within the next 490 days, with potential for around 310% profit from current levels once momentum shifts. Classic accumulation setup for patient traders.

LTC - NEUTRAL VIBESSome compared NASDAQ:DASH to ... But; #LTC price looks clearly bearish under the 105$ mark! 🔴
Current price looks stuck between the 105$ resistance and 90$ support. Nothing to do with yet.
🟩Bull plan:
Daily candle close above 102$ --> 117 - 120$ pump likely 🎯
🟥Bear plan:
H4 candle break under 89$ --> 83 - 80$ support 🎯

litecoin go brrrlitecoin go brrr,
we gonna pump litecoin because we not gonna sell more here. ppl will see it rising and gonna do nothing but then she will not stop rising and in that moment they wil try to buy and we not gonna sell to them and after that they will pay any price that binance shows because the fomo is installed. here is the momemnt wen they'll bid even higher. the rest is history.
jk
its about patterns. volume is backing the thing and i think thats all.
eveything looking good for litecoin here.
there's a second best.
PS: i've longed precisely at 20:00 because i was alerted.
LitecoinPrice of CRYPTOCAP:LTC broke out the bearish triangle and has formed a bullish triangle. Classical target would be aimed at $170. But if it is altseason now like on CRYPTOCAP:ZEC then the target should be way higher.

Litecoin (LTC): Good Bullish Setup Is Forming | Expecting Bounce3 trades can be taken here. where 2 are on 30M timeframes. Overall expecting at least a +30% movement to take place very soon!
More in-depth info is in the video—enjoy!
Swallow Academy

LTC/USDT | LTC Update – Bulls Back in Control!By analyzing the #Litecoin (LTC) chart on the weekly timeframe, we can see that after testing the $76–$88 demand zone, LTC has continued its recovery and recently climbed to around $94.5 , showing that buyers are still defending key levels strongly.
The overall structure remains bullish — as long as the price holds above $88, the outlook stays positive. The next upside targets remain $100, $114, and $120, where short-term resistance could appear before the next breakout attempt.
This steady recovery once again confirms Litecoin’s technical strength and the reliability of its long-term demand zone. If momentum holds, we could soon see another strong push toward the $100 mark and beyond.
Please support me with your likes and comments to motivate me to share more analysis with you and share your opinion about the possible trend of this chart with me !
Best Regards , Arman Shaban

LTCUSD Next Target for Bulls RevealedLTCUSD 4H Chart
The correction has already ended at 100.25 . We expect a small retracement before the trend continues. Upon closer examination, this correction appears to be subwave C of wave (4). For now, watch the 119 level for a potential bullish breakout.
LTCUSD Targets: 122 , 127 , and 132 .
Wave (4) has already reached the 0.382 Fibonacci retracement level, which may act as support near the upper boundary and serve as a possible reversal point.
Stay tuned!
@Money_Dictators
Thank you :)
