LTCUST.P trade ideas

LTC 2H LONG HRLTC is ready for an explosion after being taken out of the market and can grow up to 10%, this can be easily seen in the 2nd and 3rd fibo covers.

LTCUSD ❕ downward channelLitecoin is moving under the liquidity level, in a downward channel.
50EMA has broken down 200EMA (1H TF)
I expect the asset to decline after holding in the channel.

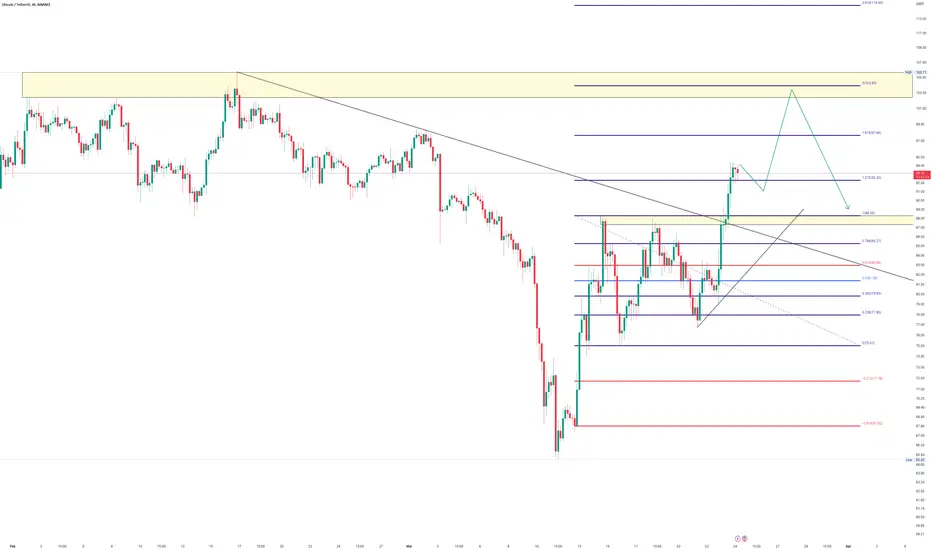
LTCUSDT Analytical reviewCurrently, there is uncertainty globally in this instrument. The current strength of the market on a scale from zero to one hundred is 37.6. If the correction continues and the price falls below the level of 80.73, it could indicate a break in the medium-term growth and the development of a downtrend. On the other hand, a move above the level of 83.19 confirms an upward trend and could lead to its strengthening. Locally, the price has formed a falling channel and has broken through it, indicating an acceleration of the local decline and a high probability of a reversal of the instrument in the medium-term perspective downwards. When the price returns back into the channel, it could indicate a continuation of sideways movement, in which case speculative deals on rebound from the channel borders are possible. Short from the level of 101.77, long from the level of 94.13. If the price solidifies above the level of 101.77, the probability of a local uptrend and the resumption of a medium-term upward trend increases.


Litecoin shortLitecoin bounced off the resistance level. Asset bounced down off the bearish trendline. Decline to support level at 88 is expected to happen.

LTCUSD - Long - Expected to hit the Levels of 132LTC has been forming an uptrend channel , and created a major support at the levels of 62.
It has broke out of the triangle and expected to move towards the 132 levels.
There is a resistance expected at the levels of 118.
How to trade?
Wait for the price to break 94 levels.
Enter for the target of 118.


LTC Price Analysis: Binance can pull the whole market down againLTC Price Analysis: Binance can pull the whole market down again
I am looking at this bearish movement from technical and fundamental perspectives.
Price may move down again considering that Binance is creating a high mess again
in the market.
The last two years have been very strange overall:)
You may find more details in the video analysis
Thank you and Good Luck!
"New YorkCNN -The US case against Binance calls out one of the worst-kept secrets in crypto
If you live in America, you’re not allowed to trade crypto derivatives.
And if you’re a big international platform for trading crypto derivatives, you can’t let Americans trade those products if you haven’t
registered with the boring-sounding but not-to-be-trifled-with federal regulator known as the Commodity Futures Trading Commission, or CFTC."
Here’s the deal: The CFTC alleges that Binance and its CEO violated US trading laws by, among other things,
secretly coaching “VIP” customers within the United States on how to evade compliance controls.
CFTC's complaint against Binance seeks permanent trading and registration bans, and other details - the block

SELL SET UP FOR LTC USDT FUTURES TRADELTCUSDT is ready to decrease in price as sellers enter the market Entry price 91.79usdt Take profit 88 usdt .Follow my past ideas and see how accurate it is.Private chat me for more reliable signals

LTCUSDT wants more liquidity?LTCUSDT is currently in a bearish pennant pattern on the charts. The pair is attempting to break out of this pattern, which could lead to a potential bullish trend.
However, there are some factors that suggest a bearish outlook for LTCUSDT. The pair is currently below the 4-hour resistance level and daily supply level, indicating a bearish sentiment in the market. Additionally, if the pair manages to break below the $94 area, it could create a new bearish impulse.
As a result, traders should wait for confirmation from Plancton's strategy before opening a short position on LTCUSDT. Plancton's confirmations could provide valuable insights into the market conditions and help traders make more informed decisions.
However, if the price of LTCUSDT breaks out above the $98 area and confirms it, the bearish scenario could be invalidated.
–––––
Follow the Shrimp 🦐
Keep in mind.
🟣 Purple structure -> Monthly structure.
🔴 Red structure -> Weekly structure.
🔵 Blue structure -> Daily structure.
🟡 Yellow structure -> 4h structure.
⚫️ Black structure -> <= 1h structure.
Follow the Shrimp 🦐


Buy Signal in LTCIf we take a closer look at Litecoin, we will notice that a buy signal has been issued. The Awesome Oscillator is in a very good position and a buy signal has been issued on the candle I specified. Stop loss is set based on ATR 14*2.

✅TS ❕ LTCUSD: still moving✅✅ LTC continues to move above the support area.
The chart is moving in an uptrend.
The asset will continue to rise.✅
🚀 BUY scenario: long to 97.11🚀
----------------------------------------------------------------------------
Remember, there is no place for luck in trading - only strategy!
Thanks for the likes and comments.

LTC | MMSM | H4 distributionPrice hit HTF POI
On its upmove price left some gaps that could acts as a draw.
H4 shows clear sign of short term reversal: H1 msb, IMH Creation
Based on that IMH Creation I assume it to hold as lower high from which pric eshould start to expand lower

Litecoin LTC price is preparing to plunge by -25-30%, where buy?Historically, when a global growth trend emerges, Litecoin is ahead of the "train" and sets the pace.
We described this in more detail, with graphs and comparisons, in our previous idea here:
If we look at the LTCUSDT chart, we will notice that while almost the entire market was still growing well in the previous weeks, the LTC price stopped before an important level.
Therefore, our assumption is that in the near future, LTCUSD may begin a significant downward correction, and the entire crypto market may follow it.
For us, the ideal zone for buying LTC long for a medium- to long-term investment is the same trading range of $65-73.
If we look at the chart of the LTCBTC pair, we will see that the price broke through the trend line at the end of 2022, which finally ended the protracted downward trend.
However, the LTCBTC price is currently in consolidation and a downward correction of 15-25% is quite realistic. Therefore, there is no need to rush to buy longs at current prices; it is safer for your deposit to wait and see how the current situation will be resolved.
_____________________
Did you like our analysis? Leave a comment, like, and follow to get more

LTC/USDT 1DAY UPDATE BY CRYPTO SANDERS Welcome to this quick LTC/USDT analysis.
I have tried my best to bring the best possible outcome in this chart.
Reason for Analysis:-Litecoin (LTC) has been one of Thursday’s biggest gainers, as prices rose by as much as 13% in today’s session.
LTC/USD raced to an intraday high of $91.70 in today’s session, a day after falling to a low of $79.95.
As a result of the move, LTC climbed to its strongest point since March 3, when the token reached a peak of $95.49.
Overall, the move has pushed the 10-day (red) moving average closer to an upwards crossover with the 25-day (blue) moving average.
Although some will be anticipating a cross, there appears to be a hurdle in place, which comes in the form of a ceiling on the relative strength index (RSI).
At the time of writing, the index is tracking at 55.35, which is marginally below the aforementioned resistance zone of 56.00.
Remember:-This is not a piece of financial advice. All investment made by me is at my own risk and I am held responsible for my own profit and losses. So, do your own research before investing in this trade.
Hit the like button if you like it and share your charts in the comments section.
Thank you...


LTCUSDT long favorable from daily supportThe price is getting pushed back from weekly resistance. Currently trading inside low time frame support zone. However, I would expect the price to go towards the daily support zone. If it comes to that zone, a long is favorable there.

LTC: Resistance BreakoutLitecoin (LTC) technical analysis:
Trade setup : Price broke back above $90 resistance to resume Uptrend, with upside potential to next resistance zone of $100-105. (set a price alert).
Trend : Downtrend on Medium-Term basis and Uptrend on Short- and Long-Term basis.
Momentum is Bullish (MACD Line is above MACD Signal Line and RSI is above 55).
Support and Resistance : Nearest Support Zone is $80 (previous resistance), then $70. The nearest Resistance Zone is $90, which it broke, then $100.

Litecoin longLitecoin broke trough the descending trendline. Asset broke trough the resistance level. Bullish movement to resistance level at 105.7 is expected to happen.

Target around 105 before dropBINANCE:LTCUSDT is going up to 105
Good point to join around 88
Wait and see