Monthly Crypto Analysis: Litecoin (LTCUSD) – Issue 99 The analyst believes that the price of Litecoin will decrease within the time specified on the countdown timer. This prediction is based on a quantitative analysis of the price trend.
___Please note that the specified take-profit level does not imply a prediction that the price will reach that point. In this framework of analysis and trading, unlike the stop-loss, which is mandatory, setting a take-profit level is optional. Whether the price reaches the take-profit level or not is of no significance, as the results are calculated based on the start and end times. The take-profit level merely indicates the potential maximum price fluctuation within that time frame.
The validity of this analysis is based on a specific time range (until 13 Nov 2025), and after this period, the analysis will be reviewed and updated (once every 28 days).
Trade ideas

LTC/USDT | LTC Holding Strong Above Support – Breakout Incoming?By analyzing the Litecoin (LTC) chart on the weekly (logarithmic) timeframe, we can see that the price has risen to $100, successfully hitting the first target from the previous analysis.
Currently, LTC is trading around $96, and it’s important to see whether the price can hold above the $76–$88 support zone. If it does, we could expect a strong bullish move ahead. The next targets are $114 and $120.
Please support me with your likes and comments to motivate me to share more analysis with you and share your opinion about the possible trend of this chart with me !
Best Regards , Arman Shaban
litecoin spot plansLTC has been consolidating inside a massive 7-year symmetrical triangle, forming a clean A–B–C–D–E corrective structure. With wave E nearly complete, the pattern is 99% mature — a decisive breakout could be imminent.
This range has trapped traders for years, but structures like this don’t appear every day. Once this triangle resolves, volatility will return and LTC could finally make a macro move after years of compression.
Invalidation below $40.6.

LTC has formed a bearish pennantLTC has formed a bearish pennant, and this pattern suggests a downward price movement
Current price: $94.51
This pattern suggests a downward price movement to $90 and $85
A price rebound to $102 is likely

LTC Holds Strong Support, Eyes Resistance at 101LTC Holds Strong Support, Eyes Resistance at 101
LTC has established a strong support zone near 90-91 after the decline that occurred last week.
At the moment, the price is holding firmly above this zone and seems to have also established a trading range between 91 and 101.
I think there is a high chance that LTC will rise again with the target at 101. If the price manages to break this zone, it should continue to rise to the second target of 106 and possibly 111.
You may find more details in the chart!
Thank you and Good Luck!
❤️PS: Please support with a like or comment if you find this analysis useful for your trading day❤️

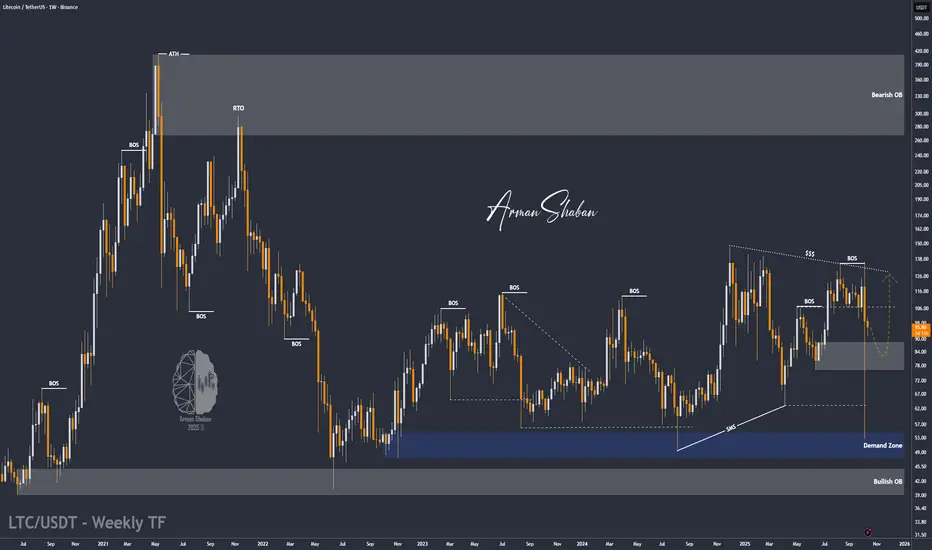
LTC/USDT | Litecoin’s 30% Rise Marks the Start of a Bigger Move!By analyzing the Litecoin (LTC) chart on the weekly (logarithmic) timeframe, we can see that the price started rising from around $115 after the last analysis and has now reached $133, marking a solid gain of over 30% so far!
If the current momentum continues, we could see Litecoin moving even higher. The next bullish targets are $155, $200, and $268.
Please support me with your likes and comments to motivate me to share more analysis with you and share your opinion about the possible trend of this chart with me !
Best Regards , Arman Shaban

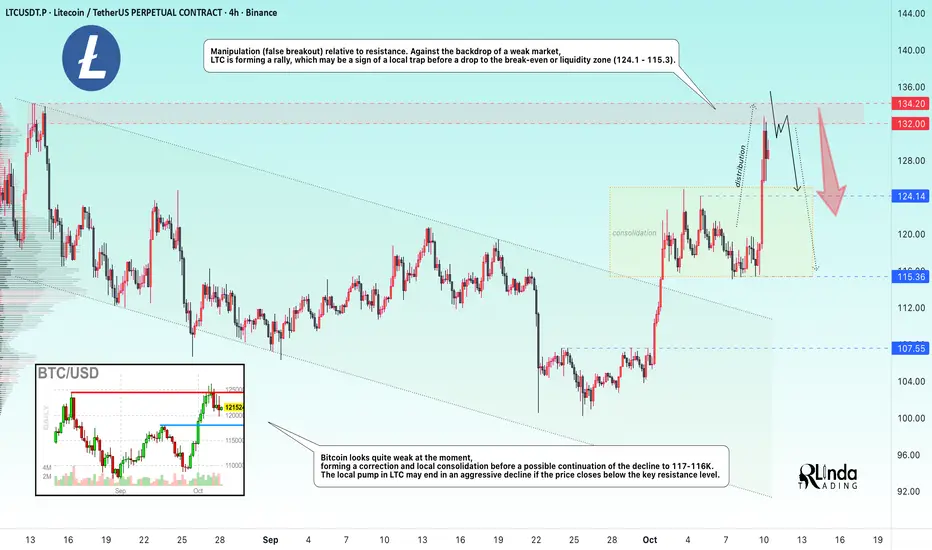
LTCUSDT → False breakout of resistance...BINANCE:LTCUSDT is forming a distribution pattern after local consolidation. The price is testing the resistance zone and forming a false breakout, but there is a but. The cryptocurrency market is in correction...
Bitcoin looks quite weak at the moment, forming a correction and local consolidation before a possible continuation of the decline to 117-116K. The local pump in LTC may end in an aggressive decline if the price closes below the key resistance level.
Manipulation (false breakout) relative to resistance. Against the backdrop of a weak market, LTC is forming a rally, which may be a sign of a local trap before a drop to the break-even or liquidity zone (124.1 - 115.3).
Resistance levels: 132.0, 134.2
Support levels: 124.14, 115.36
A false breakout of resistance, while the entire altcoin market is declining, looks like a hunt for liquidity before catching up with the main market. Accordingly, confirmation of a false breakout of the resistance zone could trigger a drop in LTC.
Sincerely, R. Linda!
LTCUSDT (Crypto) Long🌎Litecoin (LTC) is a decentralized peer-to-peer cryptocurrency created in 2011 as an alternative to Bitcoin. It was designed to provide faster and cheaper transactions, positioning itself as "digital silver" to Bitcoin's "digital gold."
The primary goal of Litecoin's creation was to become a more efficient means of instant payments and transfers than Bitcoin.
Litecoin operates on the Proof-of-Work principle, like Bitcoin, but uses the Scrypt algorithm.
The Scrypt algorithm was initially chosen to counter specialized mining hardware (ASICs), keeping mining more decentralized. Although ASICs for Scrypt have been developed over time, this algorithm still requires more memory than SHA-256, which is used in Bitcoin.
The Litecoin network has successfully implemented important upgrades such as Segregated Witness (SegWit) and the Lightning Network, which increase throughput and enable instant microtransactions.
Litecoin has a stated maximum supply of 84 million LTC, four times greater than Bitcoin.
Litecoin block times and transactions are confirmed significantly faster than Bitcoin. This, along with a less congested network, results in very low fees.
A growing number of merchants accepting LTC and integration with payment systems (such as the partnership with Spend)
Litecoin's partnership with the Spend platform (also known as SPEDN by Flexa) was part of a broader integration aimed at making spending Litecoin and other cryptocurrencies in everyday life simple and instant.
This partnership was a joint effort between several parties: the Litecoin Foundation, Nexus Wallet, and the Flexa payment network, which operates the SPEDN app.
At the peak of the partnership, the Flexa network included over 41,000 merchants, primarily in North America, where SPEDN payments were accepted. Here are some well-known companies that accepted payments through this system:
Lowe's, Petco, GameStop, Bed Bath & Beyond, Nordstrom
Why this partnership was important:
It directly linked digital currency to real goods and services.
It also clearly demonstrated Litecoin's advantages—speed (2.5 minutes per block) and low fees.
Today, the SPEDN app is no longer available, but the Flexa payment network itself continues to operate and develop other solutions. Litecoin remains available for spending—through other services, such as BitPay (crypto debit cards and gift cards) or directly at a growing number of online and offline merchants.
In investing and trading, we treat cryptocurrencies as an asset class tied to a risk-on/risk-off regime, only with added variance, like on steroids, so to speak.
Currently, the markets are in risk-on mode, and number of factors point to the beginning of altcoin season.

Litecoin - LTC HUGE Upside Likely MID TERM (6 months)Litecoin has always been one of the giants of crypto, although it's growing slower than before.
This is likely due to all the innovation in the market, newer alts with better offerings etc.
However - LTC can, and will still be traded or many years to come. This is just because whales will trade almost ANY coin. (and if they can trade XRP to a new all time high, they can and will trade LTC ).
Every few odd months, LTC trades up+50% and above. This is every 5-7 months, or at least annually. And after the bullish W Bottom in the WEEKLY - I have high hopes for LTC.
________________
BINANCE:LTCUSDT

LTC USDTLitecoin has formed a small range where you can
Open a long position on a break of 122.77
and open a short position on a break of 115.29 from below.
This analysis reflects our opinions and is not financial advice.
Observe capital and risk management.⚠️

TradeCityPro | LTCUSDT The Best Trade Setup of the Week!👋 Welcome to TradeCityPro Channel!
Let’s move on to the analysis of the market veteran — Litecoin (LTC) — one of the oldest coins in the crypto market, which right now looks like it could offer a great trading opportunity.
🌐 Overview of Bitcoin
Before starting the analysis, let me remind you that we’ve moved the Bitcoin analysis section to a separate daily report based on your requests, so we can go into more detail about Bitcoin’s condition, price action, and dominance:
🕓 4H Time Frame
After forming higher lows inside the $101.87–$107.14 accumulation box, Litecoin finally broke through resistance and experienced a sharp upward move.
Then, after reaching the $122.74 resistance, the price got rejected and is currently testing the $115.67 support where it might consolidate for a while.
🚀 Long Position Setup:
If the price breaks the $122.74 trigger, we can easily open a long position.
In general, as long as the price stays above $115.67, long positions remain valid.
🔻 Short Position Setup:
For a short position, we first need to see a lower high form within the current range and some signs of seller pressure.
Only then, with a confirmed breakdown below $115.67, could we consider opening a risky short position.
📝 Final Thoughts
Stay calm, trade wisely, and let's capture the market's best opportunities!
This analysis reflects our opinions and is not financial advice.
Share your thoughts in the comments, and don’t forget to share this analysis with your friends! ❤️

Long trade
LTCUSDT.P — 4H Trade Journal Analysis
Bias: Buyside continuation
Phase: Re-accumulation / Breakout of consolidation
Date: Sat 4th Oct 25, 12.00 pm
Session: LND to NY Session AM
🔹 Trade Parameters
Entry: 117.69
Profit Level: 134.32 (+14.13%)
Stop Level: 117.03 (−0.56%)
R:R: 25.2
🔹 Market Context
The chart captures price structure following a prolonged accumulation range between Sept 10–22, where liquidity sweeps and demand absorption were evident.
On Mon 22nd Sept, price made a lower liquidity sweep, forming the “Consolidation Phase”, followed by a bullish displacement candle — confirming smart money entry.
Volume profile shows progressive increase on bullish pushes, signalling programmatic buy-side absorption.
🔹 Wyckoff Narrative
Phase B to D transition is evident:✅
Phase B: Range-bound equilibrium and lower liquidity sweeps.
Phase C: Final shakeout near Sept 22, marked by price made a lower sweep of liquidity.”
Phase D: Rally with SOS (Sign of Strength) and LPS (Last Point of Support) retests are now visible. Price is in markup phase — targeting premium levels toward 134–136 range (aligned with prior swing high and FVG).
Technical Confluence
EMA structure:
👉 50 EMA (blue) crossed above the 200 EMA (yellow) — signalling a confirmed bullish shift.
Both EMAs now act as dynamic support with the price riding above them.
👉 Fair Value Gaps (FVGs):
Multiple unmitigated FVGs remain below the current price at the 117–119 zone — offering re-entry potential. Additional small FVGs appear within the ascending channel — continuation structure forming.
Structure:
👉 Break of structure (BOS) confirmed at the 120 handle.
Price has since formed a bullish flag / ascending channel, consolidating above the EMA50.
Volume:
👉 Notable spike at reaccumulation phase — a sign of institutional interest during demand retest.
🔹 Outlook
Primary target: 134.32 — already within the projected markup zone.
Continuation scenario: If price sustains above 119.60–120.00, expect the next leg toward the 136–138 zone. Retracement scenario: Re-entry possible around 117.70–118.30 demand cluster / FVG. Losing 117.00 invalidates the short-term structure.
🔹 Summary
This trade represents a textbook reaccumulation breakout following a liquidity sweep and bullish confirmation. The structure aligns with Wyckoff’s schematic Phase D and ICT’s displacement model, with strong confluence from EMAs, volume, and FVG imbalances supporting further upside.
Mpping trades since 3rd August LTC (x 6 trades)

LTC - LONG SET-UP BINANCE:LTCUSDT
LTC LONG SET-UP
Entry Between 81-92
SL Below 74
Target above 115
Lev & margin as per your risk capacity

Litecoin (LTC): Expecting Breakout Very Soon | Good R:R TradeLTC is showing bullish signs, since last time we got 7% of bullish movement, and now we are looking for 15% of movement to follow!
More in-depth info is in the video—enjoy!
Swallow Academy

LTC is going to FLY really soonLTC is forming bullish structure on weekly with multiple confluences as shown in chart.
This is for sure going to fly so don't miss out when it does.
Not a Financial advice. Do your research before getting into the trade.


$LTC ?!Hi, welcome to my Litecoin idea.
This its a very bold post for LTC. If you are looking for a coin that can go from low $100 to see a 5-6X this might be your coin On AUGUST 5, 2025 MEI Pharma buys $100 million of Litecoin as treasury asset, with Charlie Lee and GSR as lead investors . Many other companies will follow behind which marks this as early opportunity for investors in every sector.
Long term is where the money is, trade safe and good luck !!!

Litecoin Testing Critical Support, 16% Rally Toward $136 Hello✌️
Let’s analyze Litecoin’s price action both technically and fundamentally 📈.
🔍Fundamental analysis:
MEI Pharma became Lite Strategy and put $100M in Litecoin (LTC).
EU rules now make LTC a regulated asset, easing big investors in and cutting sell pressure.
📊Technical analysis:
BINANCE:LTCUSDT precisely hit my previous target and is now testing two key daily supports and a critical trendline.
It is also near the upper boundary of its parallel channel.
A breakout above this level could trigger a 16% rally toward $136.
📈Using My Analysis to Open Your Position:
You can use my fundamental and technical insights along with the chart. The red and green arrows on the left help you set entry, take-profit, and stop-loss levels, serving as clear signals for your trades.⚡️ Also, please review the TradingView disclaimer carefully.🛡
✨We put love into every post!
Your support inspires us 💛 Drop a comment we’d love to hear from you! Thanks, Mad Whale

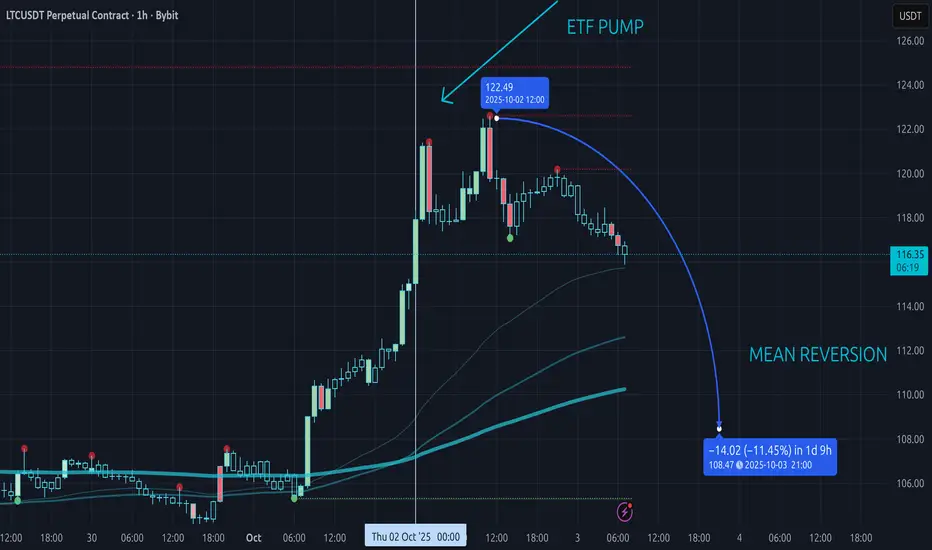
Litecoin to $400... Just not yet moonboy!Yesterday (Oct 2, 2025) was supposed to be the big day for the Canary Funds CRYPTOCAP:LTC ETF. With the government shutdown stalling agencies, the SEC didn’t issue an approval, so the “event” turned into a non-event. Meanwhile seasonality kicked in—Q4 is often bullish—and we got the standard “new month/new quarter” squeeze across crypto. LTC tagged ~$122, then started giving it back. We’re roughly ~6% off the spike already as late longs get forced out.
Here’s how I see it:
Higher time frames look constructive. On the 4H/D1 charts, structure shows a bullish reversal after August’s washout. Price held the daily 200 EMA near $100 on the last retest and pushed up cleanly. That’s the anchor for any continued upside.
Lower time frames need a reset. On the 1H, this was a textbook overextension. I’m expecting mean reversion back toward the 1H 200 EMA / prior breakout before any sustainable leg higher. Don’t get bullish into the wick highs—wait for pullbacks.
Levels I’m watching
Support: $108–$105 first, then the $100–$95 zone (daily 200 EMA). Lose that area with acceptance and LTC can do what it loves—round-trip—bringing $80 → $70–$65 back into view.
Resistance: $122–$125 intraday supply, then the $135–$140 pocket near the descending trendline. A clean break/hold above $140 opens the door to $150.
Bottom line: Short-term, I’m bearish into a pullback as price reverts toward the mean. On 4H/D1, I’m still bullish as long as $100–$95 holds—if we base there, I like the $140 magnet later this quarter. Just remember: Litecoin is notorious for mean-reverting. Trade the pullbacks; don’t chase the spikes.
#LTC/USDT analysis.Give me some energy !!!#LTC
The price is moving within a descending channel on the 1-hour frame, adhering well to it, and is heading for a strong breakout and retest.
We have a bearish trend on the RSI indicator that is about to be broken and retested, supporting the upside.
There is a major support area (marked in green) at 107.50, which represents a strong basis for the upside.
For inquiries, please leave a comment.
We are in a consolidation trend above the 100 moving average.
Entry price: 111.15
First target: 112.80
Second target: 114.70
Third target: 117
Don't forget a simple matter: capital management.
When you reach the first target, save some money and then change your stop-loss order to an entry order.
For inquiries, please leave a comment.
Thank you.

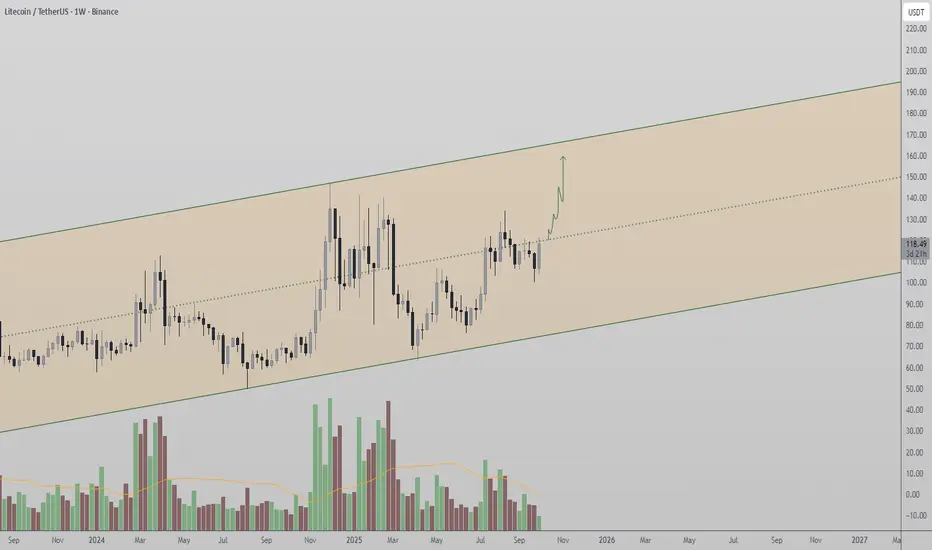
Litecoin Consolidates Within Weekly Channel, Eyes $167 TargetLitecoin remains in a long-term weekly channel and is currently consolidating around its midpoint. Holding above this level increases the probability of an expansion toward $167 resistance.
Litecoin’s price action is developing within a high timeframe channel, with each candle representing a weekly period. The asset is now positioned around the midpoint of this range, creating a critical technical base for determining future direction.
Key Technical Points:
- Weekly channel structure defines Litecoin’s broader price action.
- Currently consolidating around the channel midpoint.
- Potential upside target lies at $167 channel resistance.
Litecoin’s channel formation underscores its long-term structure, with price consolidating mid-range. Maintaining closes above this level increases the probability of a bullish continuation toward the channel’s upper resistance.
The consolidation phase suggests indecision but also prepares the ground for expansion. A decisive move in the coming weeks will determine whether price rallies toward $167 or breaks lower to retest channel supports.
What to Expect in the Coming Price Action:
Litecoin is likely to resolve its consolidation soon, with bullish continuation toward $167 favored if the midpoint holds. Traders should monitor volume shifts for clues on breakout direction.
Evening market reviewHello traders,
It's been a while since I saw a high-probable set-up shaping up on a top 10 crypto-pair.
Positioned extremely well.
Also a neutral perspective on USD-pairs.
CRYPTO:LTCUSD
FX:USDCHF

Litecoin (LTC): Expecting a Good Buy Opportunity Soon | Bullish LTC looks like it's about to break that neckline area so we are waiting for it to happen—as soon as it happens, we are going to get an opportunity for a long!
More in-depth info is in the video—enjoy!
Swallow Academy
