How I frame my Bias on Stocks? Part 1. Showing multiple examples of stock delivery and how you can do the same on a 5min timeframe
Next report date
—
Report period
—
EPS estimate
—
Revenue estimate
—
10.80 INR
26.44 B INR
157.36 B INR
808.75 M
About L&T Finance Ltd
Sector
Industry
CEO
Sudipta Roy
Website
Headquarters
Mumbai
Founded
2008
ISIN
INE498L01015
FIGI
BBG0016X7DF6
L&T Finance Ltd. is a non-banking financial company, which engages in the provision of financial products and services across retail, corporate, housing, and infrastructure finance sectors. It operates through the following segments: Rural Finance, Housing Finance, Infrastructure Finance, Defocused Business and Others. The Rural Finance segment comprises of farm equipment finance, two wheeler finance, and micro loans. The Housing Finance segment includes home loans, loan against property, and real estate finance. The Infrastructure Finance segment comprises of infrastructure business. The Defocused Business segment consists of structured corporate loans, debt capital market, commercial vehicle finance, construction equipment finance, SME term loans and leases. The Others segment deals in the asset and wealth management. The company was founded on May 1, 2008 and is headquartered in Mumbai, India.
Related stocks

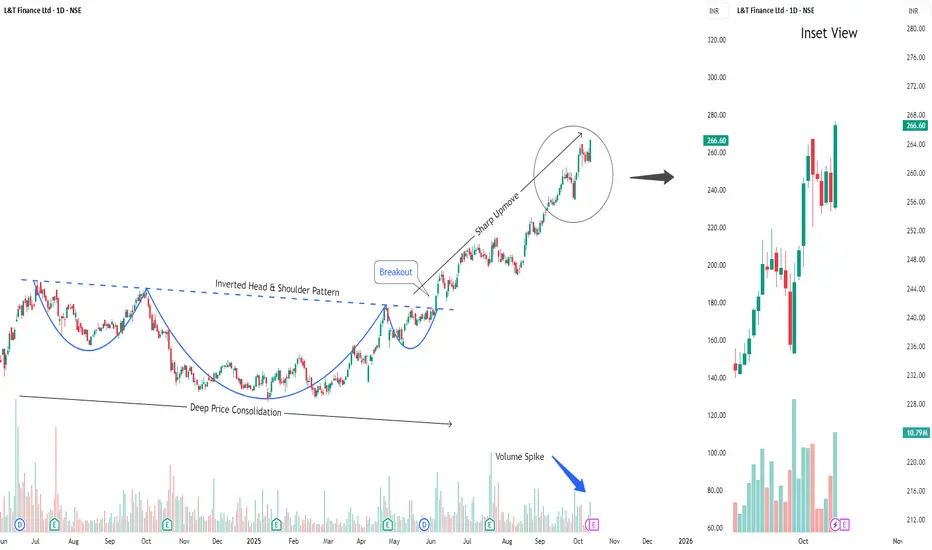
L&T Finance: Creating New Highs L&T Finance: Record Breaking Journey Continues, Creating new Highs .
( Not a Buy / Sell Recommendation
Do your own due diligence ,Market is subject to risks, This is my own view and for learning only .)

Buy L&T FinanceShort Term Trading Advice by Goodluck Capital
Buy L&T Finance
● Buy Range- 262 - 266
● Target- 280 - 285
● StopLoss- below 252
● Upside Potential- 6% -8%
● Approx trade duration 12 - 14 days
ATH_LTFHi traders,
Currently LTF is trading @ ATH with breakout of strong Bullish Candle.
Long until it breaks previous day low or Market structure and Ride the Trend.

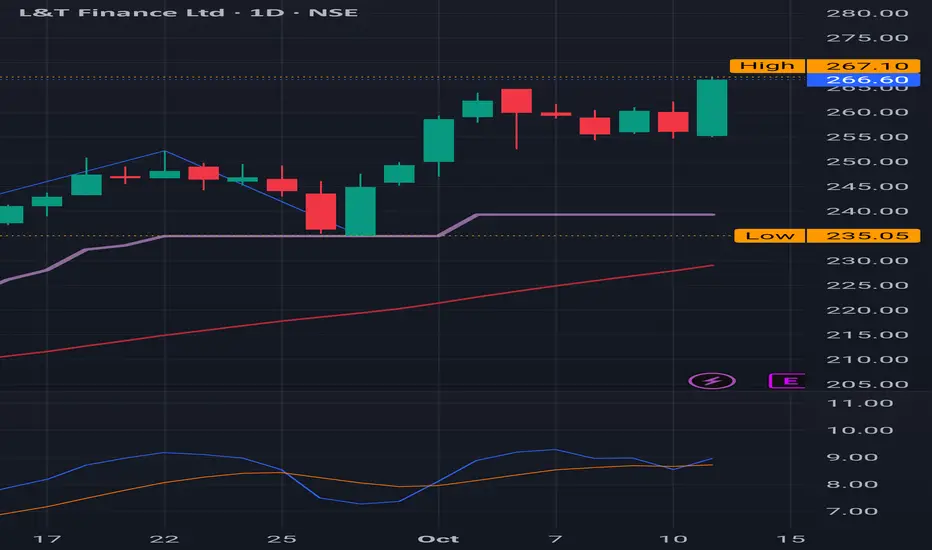
L&T Finance Ltd Analysis Key Highlights :
View : Bearish
1. Entry : 267
2. Stoploss : 270
3. Target : 263, 254

L&T Finance : Doubled the money in 7 months L&T Finance : Doubled the money in 7 months
March 2025 : 130 ish
October 2025 : 260 ish
(MONTHLY CHART )
( Not a Buy / Sell Recommendation
Do your own due diligence ,Market is subject to risks, This is my own view and for learning only .)

L&T Finance : Creating new Highs L&T Finance : Creating new Highs .
( Not a Buy / Sell Recommendation
Do your own due diligence ,Market is subject to risks, This is my own view and for learning only .)
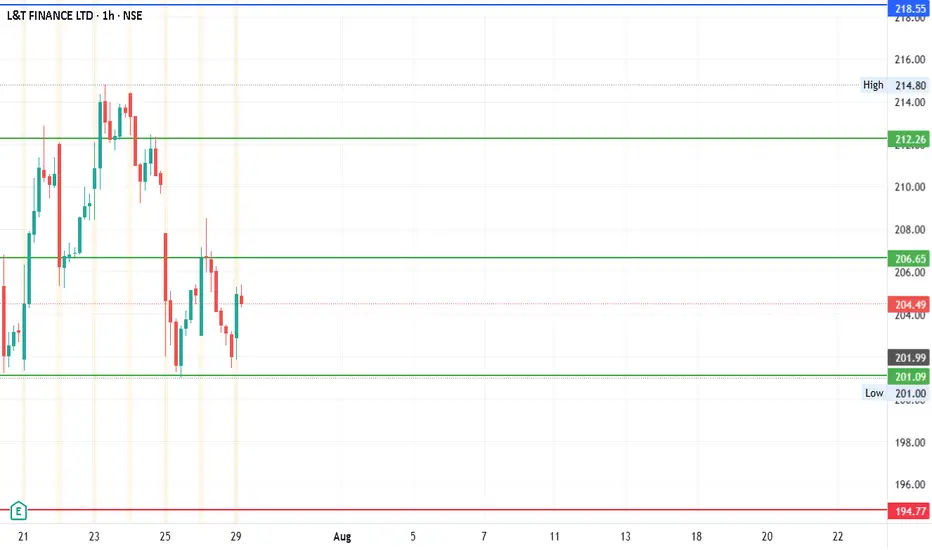
#LTF - 25 Points move expected?Date: 08-07-2025
LTFinance Current Price: 205.3
Pivot Point: 206.65 Support: 201.09 Resistance: 212.25
Upside Targets:
Target 1: 218.55
Target 2: 224.85
Target 3: 231.67
Target 4: 238.50
Downside Target
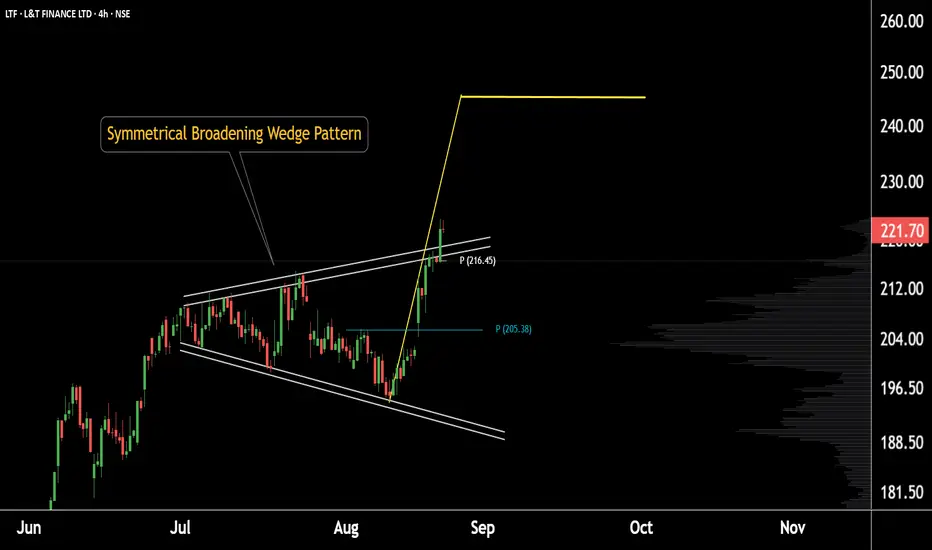
L&T Finance breakout in action – bulls taking chargeThis is the daily chart of L&T Finance.
The stock has been forming a broadening wedge pattern and has recently given a pattern breakout around 220.
Currently, L&T Finance is sustaining above its daily pivot level of 216, with strong support in the 215–220 zone.
If this support holds, we may witness
L&T Finance: Creating New Highs
L&T Finance: Creating New Highs.
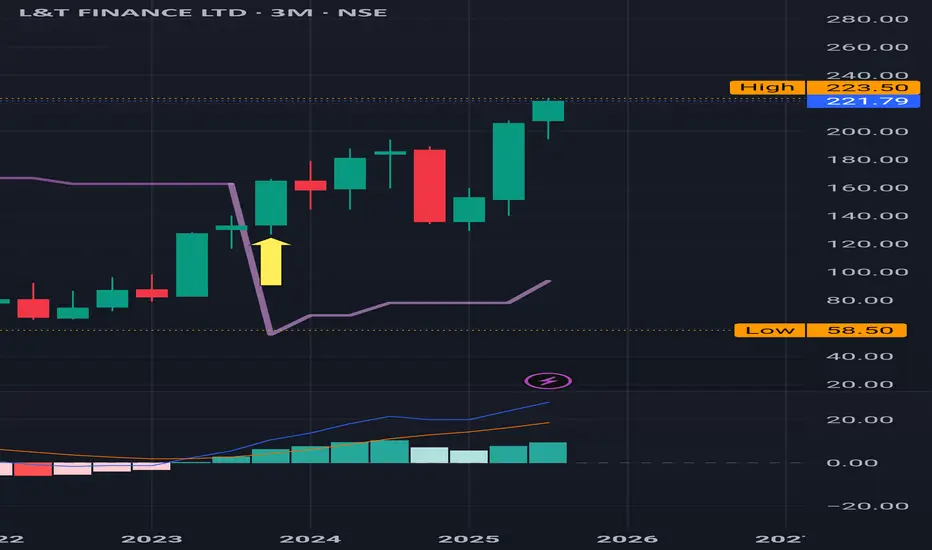
After a Buy Signal Triggered on a 3 Months Time Frame in October 2023 it hasn't looked back and ,creating new highs for past couple of sessions.
It's in a Buy trajectory in a Daily / Monthly / 3 monthly time frame .
( Not a Buy / Sell Recommendation
Do your o
See all ideas
Summarizing what the indicators are suggesting.
Neutral
SellBuy
Strong sellStrong buy
Strong sellSellNeutralBuyStrong buy
Neutral
SellBuy
Strong sellStrong buy
Strong sellSellNeutralBuyStrong buy
Neutral
SellBuy
Strong sellStrong buy
Strong sellSellNeutralBuyStrong buy
An aggregate view of professional's ratings.
Neutral
SellBuy
Strong sellStrong buy
Strong sellSellNeutralBuyStrong buy
Neutral
SellBuy
Strong sellStrong buy
Strong sellSellNeutralBuyStrong buy
Neutral
SellBuy
Strong sellStrong buy
Strong sellSellNeutralBuyStrong buy
Displays a symbol's price movements over previous years to identify recurring trends.
81LTF30
L&T Infrastructure Finance Company Limited 8.1% 28-JUN-2030Yield to maturity
7.91%
Maturity date
Jun 28, 2030
8LTF20
L&T Finance Limited 8.55% 28-JAN-2030Yield to maturity
6.61%
Maturity date
Jan 28, 2030
898LTF29
L&T Finance Ltd. (India) 8.98% 13-MAR-2029Yield to maturity
6.11%
Maturity date
Mar 13, 2029
87LTF27
L&T Finance Limited 8.7% 15-APR-2027Yield to maturity
6.08%
Maturity date
Apr 15, 2027
935LTF29
L&T Finance Ltd. (India) 9.35% 13-MAR-2029Yield to maturity
5.89%
Maturity date
Mar 13, 2029
905LTF27
L&T Finance Limited 9.05% 15-APR-2027Yield to maturity
3.24%
Maturity date
Apr 15, 2027
85LTF26
L&T Finance Ltd. (India) 8.5% 23-DEC-2026Yield to maturity
0.78%
Maturity date
Dec 23, 2026
865LTF26
L&T Finance Limited 8.65% 23-DEC-2026Yield to maturity
0.28%
Maturity date
Dec 23, 2026
83LTF30
L&T Infrastructure Finance Company Limited 8.3% 10-JUN-2030Yield to maturity
—
Maturity date
Jun 10, 2030
842LTF29
L&T Finance Limited 8.42% 24-SEP-2029Yield to maturity
—
Maturity date
Sep 24, 2029
72190LTFL2.N0
L&T Finance Limited 7.219% 10-NOV-2028Yield to maturity
—
Maturity date
Nov 10, 2028
See all LTF bonds
Frequently Asked Questions
The current price of LTF is 312.35 INR — it has increased by 1.33% in the past 24 hours. Watch L&T Finance Ltd stock price performance more closely on the chart.
Depending on the exchange, the stock ticker may vary. For instance, on NSE exchange L&T Finance Ltd stocks are traded under the ticker LTF.
LTF stock has risen by 7.63% compared to the previous week, the month change is a 16.35% rise, over the last year L&T Finance Ltd has showed a 122.39% increase.
We've gathered analysts' opinions on L&T Finance Ltd future price: according to them, LTF price has a max estimate of 330.00 INR and a min estimate of 143.00 INR. Watch LTF chart and read a more detailed L&T Finance Ltd stock forecast: see what analysts think of L&T Finance Ltd and suggest that you do with its stocks.
LTF stock is 2.30% volatile and has beta coefficient of 1.60. Track L&T Finance Ltd stock price on the chart and check out the list of the most volatile stocks — is L&T Finance Ltd there?
Today L&T Finance Ltd has the market capitalization of 780.69 B, it has increased by 6.79% over the last week.
Yes, you can track L&T Finance Ltd financials in yearly and quarterly reports right on TradingView.
L&T Finance Ltd is going to release the next earnings report on Jan 16, 2026. Keep track of upcoming events with our Earnings Calendar.
LTF earnings for the last quarter are 2.94 INR per share, whereas the estimation was 2.95 INR resulting in a −0.51% surprise. The estimated earnings for the next quarter are 2.84 INR per share. See more details about L&T Finance Ltd earnings.
L&T Finance Ltd revenue for the last quarter amounts to 26.92 B INR, despite the estimated figure of 26.22 B INR. In the next quarter, revenue is expected to reach 28.34 B INR.
LTF net income for the last quarter is 7.35 B INR, while the quarter before that showed 7.01 B INR of net income which accounts for 4.81% change. Track more L&T Finance Ltd financial stats to get the full picture.
Yes, LTF dividends are paid annually. The last dividend per share was 2.75 INR. As of today, Dividend Yield (TTM)% is 0.88%. Tracking L&T Finance Ltd dividends might help you take more informed decisions.
L&T Finance Ltd dividend yield was 1.80% in 2024, and payout ratio reached 25.93%. The year before the numbers were 1.58% and 26.77% correspondingly. See high-dividend stocks and find more opportunities for your portfolio.
As of Nov 30, 2025, the company has 36.52 K employees. See our rating of the largest employees — is L&T Finance Ltd on this list?
EBITDA measures a company's operating performance, its growth signifies an improvement in the efficiency of a company. L&T Finance Ltd EBITDA is 60.31 B INR, and current EBITDA margin is 76.89%. See more stats in L&T Finance Ltd financial statements.
Like other stocks, LTF shares are traded on stock exchanges, e.g. Nasdaq, Nyse, Euronext, and the easiest way to buy them is through an online stock broker. To do this, you need to open an account and follow a broker's procedures, then start trading. You can trade L&T Finance Ltd stock right from TradingView charts — choose your broker and connect to your account.
Investing in stocks requires a comprehensive research: you should carefully study all the available data, e.g. company's financials, related news, and its technical analysis. So L&T Finance Ltd technincal analysis shows the strong buy rating today, and its 1 week rating is strong buy. Since market conditions are prone to changes, it's worth looking a bit further into the future — according to the 1 month rating L&T Finance Ltd stock shows the strong buy signal. See more of L&T Finance Ltd technicals for a more comprehensive analysis.
If you're still not sure, try looking for inspiration in our curated watchlists.
If you're still not sure, try looking for inspiration in our curated watchlists.