LTTS: Turnaround Play for 30% Upside Potential⚡ Price Analysis:
1️⃣ Price is starting to form a higher low base formation.
2️⃣ Good strong candle formation is needed for further upside move.
3️⃣ Volume: If accompanied by rising volume, this price move confirms genuine bullish interest and possible institutional participation.
4️⃣ The marked bl
Next report date
—
Report period
—
EPS estimate
—
Revenue estimate
—
119.85 INR
12.67 B INR
106.70 B INR
27.52 M
About L&T Technology Services Ltd.
Sector
CEO
Amit Chadha
Website
Headquarters
Vadodara
Founded
2013
ISIN
INE010V01017
FIGI
BBG00D2S05F9
L&T Technology Services Ltd. offers consultancy, design, development and testing services across the product and process development life cycle. It operates through the following segments: Transportation, Telecom & Hi-Tech, Industrial Products, Plant Engineering and Medical Devices. The company was founded by Anil Kumar Manibhai Naik on June 14, 2012 and is headquartered in Vadodara, India.
Related stocks

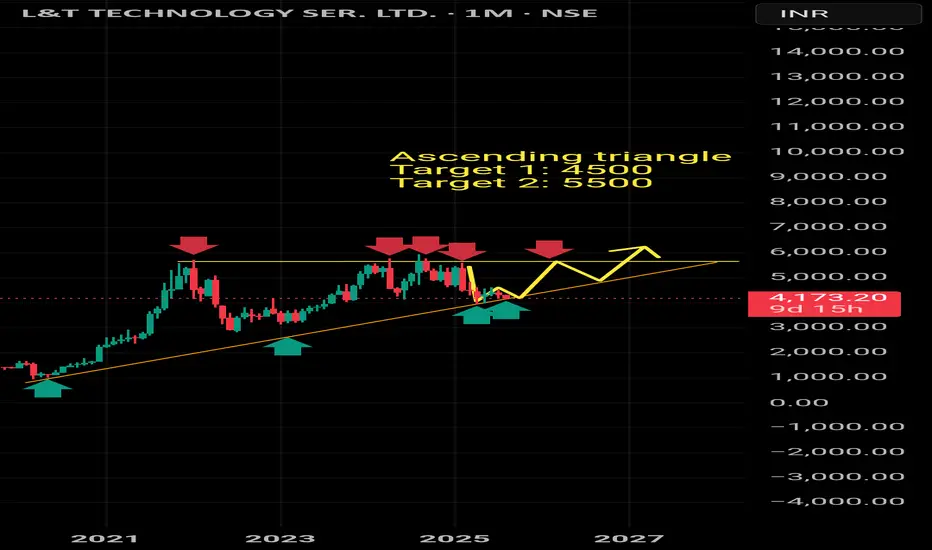
Ascending triangle pattern Price formed W pattern in weekly TF.
Indicator like MACD, Stochastic RSi showing upside.
Target 1: 4500
Target 2: 5500
Review and plan for 17th July 2025 Nifty future and banknifty future analysis and intraday plan.
This video is for information/education purpose only. you are 100% responsible for any actions you take by reading/viewing this post.
please consult your financial advisor before taking any action.
----Vinaykumar hiremath, CMT

LTTS Weekly Trade Setup(14th-18th July 2025) – Parallel ChannelThis week, L&T Technology Services (LTTS) is showing a potential breakout opportunity that requires patience and precision. As the stock approaches a key resistance zone near ₹4445, traders should resist the urge to jump in early and instead wait for a breakout and confirmed re-test before entering

L&T TECHNOLOGY SER LTD S/RSupport and Resistance Levels:
Support Levels: These are price points (green line/shade) where a downward trend may be halted due to a concentration of buying interest. Imagine them as a safety net where buyers step in, preventing further decline.
Resistance Levels: Conversely, resistance levels (re

L & T tech long position swing tradethis chart is published in 1D tf. For more clarity use 1W tf.
stock has faced rejection from top multiple time. This time it might be just retracement.
target is based on fibo tool.

LTT Preempting Horizontal Line & Rounding Bottom Breakout!🚀 LTTS: Near All-Time High and Preempting Horizontal Line & Rounding Bottom Breakout! 🚀
Current Market Price: 5431
Stop Loss: 4927
Target: 8980
LTTS is gearing up for a major long-term rounding bottom breakout above the critical level of 5955. The stock is contracting near this level, indicating p

GRAB It Before Breakout...L&T Technology Service Ltd seen a breakout above 5800. Now its trading in range upto 4800-5800. You can watch a big upside move after breakout and its next resisence is 8000-8200...


LTTS BREAKOUT RESISTANCE ZONE AND CUP AND HANDLE PATTERN**Explanation:**
This trading system helps you avoid blind trades by providing confirmation for better entries and exits. It considers volume, past prices, and price range.
**Entry/Exit Points:**
- **Entry/Exit Lines:** Use the GREEN line for long trades and the RED line for short trades, based o

See all ideas
Summarizing what the indicators are suggesting.
Neutral
SellBuy
Strong sellStrong buy
Strong sellSellNeutralBuyStrong buy
Neutral
SellBuy
Strong sellStrong buy
Strong sellSellNeutralBuyStrong buy
Neutral
SellBuy
Strong sellStrong buy
Strong sellSellNeutralBuyStrong buy
An aggregate view of professional's ratings.
Neutral
SellBuy
Strong sellStrong buy
Strong sellSellNeutralBuyStrong buy
Neutral
SellBuy
Strong sellStrong buy
Strong sellSellNeutralBuyStrong buy
Neutral
SellBuy
Strong sellStrong buy
Strong sellSellNeutralBuyStrong buy
Displays a symbol's price movements over previous years to identify recurring trends.
MIDCAPETF
Mirae Asset Nifty Midcap 150 ETF Exchange Traded Fund UnitsWeight
0.34%
Market value
426.58 K
USD
Explore more ETFs
Frequently Asked Questions
The current price of LTTS is 4,324.50 INR — it has increased by 0.81% in the past 24 hours. Watch L&T Technology Services Ltd. stock price performance more closely on the chart.
Depending on the exchange, the stock ticker may vary. For instance, on NSE exchange L&T Technology Services Ltd. stocks are traded under the ticker LTTS.
LTTS stock has risen by 6.36% compared to the previous week, the month change is a 3.01% rise, over the last year L&T Technology Services Ltd. has showed a −15.21% decrease.
We've gathered analysts' opinions on L&T Technology Services Ltd. future price: according to them, LTTS price has a max estimate of 5,770.00 INR and a min estimate of 3,460.00 INR. Watch LTTS chart and read a more detailed L&T Technology Services Ltd. stock forecast: see what analysts think of L&T Technology Services Ltd. and suggest that you do with its stocks.
LTTS reached its all-time high on Aug 29, 2024 with the price of 6,000.00 INR, and its all-time low was 712.25 INR and was reached on Jun 30, 2017. View more price dynamics on LTTS chart.
See other stocks reaching their highest and lowest prices.
See other stocks reaching their highest and lowest prices.
LTTS stock is 2.22% volatile and has beta coefficient of 1.27. Track L&T Technology Services Ltd. stock price on the chart and check out the list of the most volatile stocks — is L&T Technology Services Ltd. there?
Today L&T Technology Services Ltd. has the market capitalization of 454.36 B, it has decreased by −1.77% over the last week.
Yes, you can track L&T Technology Services Ltd. financials in yearly and quarterly reports right on TradingView.
L&T Technology Services Ltd. is going to release the next earnings report on Nov 14, 2025. Keep track of upcoming events with our Earnings Calendar.
LTTS earnings for the last quarter are 29.77 INR per share, whereas the estimation was 29.08 INR resulting in a 2.38% surprise. The estimated earnings for the next quarter are 30.13 INR per share. See more details about L&T Technology Services Ltd. earnings.
L&T Technology Services Ltd. revenue for the last quarter amounts to 28.66 B INR, despite the estimated figure of 29.07 B INR. In the next quarter, revenue is expected to reach 29.75 B INR.
LTTS net income for the last quarter is 3.16 B INR, while the quarter before that showed 3.11 B INR of net income which accounts for 1.48% change. Track more L&T Technology Services Ltd. financial stats to get the full picture.
L&T Technology Services Ltd. dividend yield was 1.22% in 2024, and payout ratio reached 45.95%. The year before the numbers were 0.91% and 40.54% correspondingly. See high-dividend stocks and find more opportunities for your portfolio.
As of Oct 6, 2025, the company has 23.34 K employees. See our rating of the largest employees — is L&T Technology Services Ltd. on this list?
EBITDA measures a company's operating performance, its growth signifies an improvement in the efficiency of a company. L&T Technology Services Ltd. EBITDA is 18.99 B INR, and current EBITDA margin is 17.99%. See more stats in L&T Technology Services Ltd. financial statements.
Like other stocks, LTTS shares are traded on stock exchanges, e.g. Nasdaq, Nyse, Euronext, and the easiest way to buy them is through an online stock broker. To do this, you need to open an account and follow a broker's procedures, then start trading. You can trade L&T Technology Services Ltd. stock right from TradingView charts — choose your broker and connect to your account.
Investing in stocks requires a comprehensive research: you should carefully study all the available data, e.g. company's financials, related news, and its technical analysis. So L&T Technology Services Ltd. technincal analysis shows the buy rating today, and its 1 week rating is neutral. Since market conditions are prone to changes, it's worth looking a bit further into the future — according to the 1 month rating L&T Technology Services Ltd. stock shows the neutral signal. See more of L&T Technology Services Ltd. technicals for a more comprehensive analysis.
If you're still not sure, try looking for inspiration in our curated watchlists.
If you're still not sure, try looking for inspiration in our curated watchlists.