IWM analysisIWM – stuck in a downward channel making lower highs and lows. Until this sequence is broken, path of least resistance is down.
IWM trade ideas

Opening (IRA): IWM March 11th 170 Short Put... for a 2.59 credit.
Comments: Selling the weekly nearest 45 days until expiry/strike nearest 16 delta in the broad market exchange-traded fund with the highest 30-day on the board to emulate dollar cost averaging into small caps.

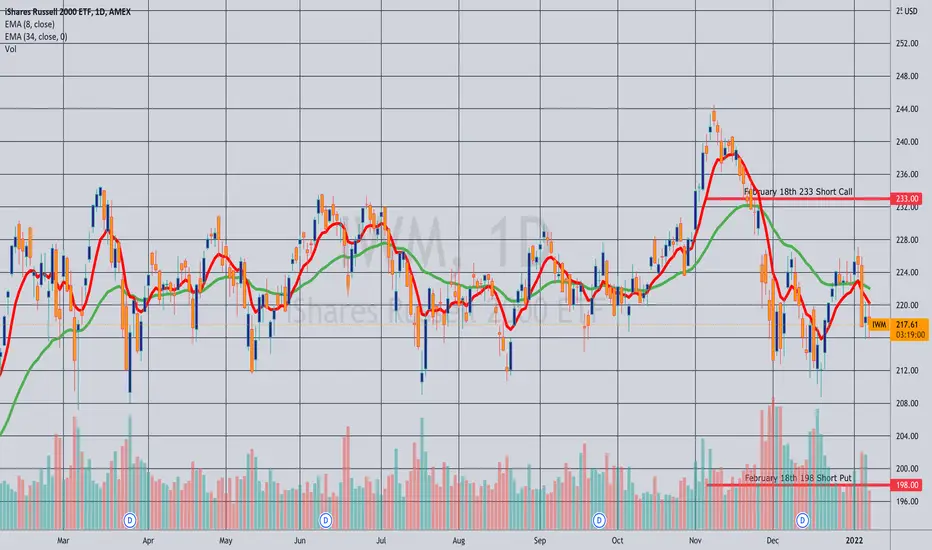
Opening (Margin): IWM February 18th 198/233 Short Strangle... for a 3.57 credit.
Comments: I'm pretty much in everything at the top of the exchange-traded fund board and wanted to deploy a little more buying power before the February monthly shortens too much in duration, so selling premium in the broad market exchange-traded fund with the highest background implied. 3.57 on buying power effect of 28.05 (on margin); 12.7% ROC at max; 6.4% at 50% max. Will look to take profit at 50% max; manage sides on approaching worthless/side test.
Opened: IWM February 25th 197/300 Short Strangle... for a 3.27 credit.
Comments: Here, just adding in a little IWM in the weeklies around 45 days until expiry while I wait for the March monthly to shorten in duration to do other stuff.
3.27 on buying power effect of 26.15; 12.5% ROC as a function of buying power effect (on margin); 6.3% ROC at 50% max.

Small-Caps Lose During Periods of Rate HikesThe Russell 2000 ETF (IWM), comprised of the 2000 smallest companies in the greater Russell 3000, is a proxy for small-cap public companies.
Small-caps tend to experience amplified interest expense burden as federal policy rates are lifted (as they are expected to be lifted a whole 100bps through 2022). This is because small-caps have a third of their debt in variable interest rates—meaning as rates rise, the interest expense they pay on debt increases (Source: Bloomberg (below)).
The IWM currently sits at a price level of interest to traders around 12/2020 and 1/2021—buyers and sellers fought to push prices beyond ~$192. During this visit to the price level of interest, the Federal Reserve statements of higher future interest rates may act as a catalyst, playing in favor of sellers.
Further, as investors' money flies from unprofitable growth companies to stable, profitable growth companies, IWM faces pressure. 31% of the companies making up IWM are unprofitable, compared to only 5.7% of the Russell 1000 (largest 1000 companies).
This pair of catalysts may be the breaking point of $192. However, from a historical perspective, it seems that small-caps tend to recover their losses during rising interest rate environments approximately a year after the first hike. Meaning a revisit of the ~$169 price level could be an interesting buying opportunity for long-term traders. More research is needed surrounding the recovery of small caps amid increasing rates. Any ideas or supporting research are welcomed. Thanks.
Sources: Bloomberg, WSJ
(Unfortunately cannot post links to these articles as a basic member; please message me for the sources).

$SPY $IWM Danger Will Robinson!This support better hold or its down to the 50% Fib re-tracement at 171. From 2020 low to recent high

Swing puts again for IWMI am buying 18Feb puts with IWM over 202. Most volume is at 188 and 195 strikes. I will exit if price gets over 203.50 204.50, 205. Then I will wait and see if IWM moves up to 208-210, or all the way back to daily 20sma, and start a new swing trade.
30m chart shows consolidation wedge, which I am watching for break downwards. Arrows show indicators will move lower again. In strong downtrends, RSI (30m) usually reverses near 60, or in a strong bounce rally it could push up to 65.

Day Trade MechanicsRarely do I post short dated trades, but wanted to provide people some insight into market mechanics. Within a panic selloff with the full support of the fed, (as it stands today) as rule thumb remember efficient market pricing and use it too your benefit. Count on simple indicators and pragmatic decision making while trading small lots in options or tight stops if long outright. Most importantly, stick to your trading system to profit in every market environment. Will update by end of Day.
PSA => Fed meeting tomorrow
Personal Trading Tip: Don't fight the Fed
Long IWM 200 Call 01/28 @ 2.50
Long IWM 200/203 Debit Spread 01/26 @ .99
NOT FINANCIAL ADVICE
Best of Luck Traders!

IWM has bottomedWith the move down today and subsequent reversal it is likely IWM has bottomed. We can see that the pattern the last few months is corrective in nature taking an ABC course but the Russell has a lot of work to do to prove it wants to go higher long term. Short term I am am bullish based on MFI reaching very oversold levels, fibonacci extensions being hit and near perfect symmetry with an only 20 cent delta b/w the A and C legs of the ABC

IWM 170/165 Put Credit SpreadIWM 170/165 Put Credit Spread - 10% RoM - Love the level I got this at.

IWM calls for an oversold bouncePuts have done very well on small caps (chart is linked). Now indicators, especially RSI, show that selling needs a pause and IWM can rally up from here.
I bought weekly 198 calls and will exit between today and Wednesday. For this trade I am making a full exit if price breaks 191.

Meaningless JargonTruly am making my best effort to just snapshot any wave pattern I think possible. Unfortunately, there is only one true answer out of thousands of possibilities.
Cannot take this market anymore.

IWM: The most interesting chart in the world: As of Friday (Jan 21) IWM has fallen out of a long range of distribution, produced both daily and weekly closes outside the trading range, and importantly has the potential to produce a large move. In this piece we discuss the trading range, mostly from a Wyckoff perspective, show multiple ways to start thinking about how far the move might progress, and finally take a look at IWM in terms of its strength relative to the higher quality SPX.
Again, there is not a trading recommendation attached to these observations. The CMT course offers an excellent way to learn more about the concepts discussed below.
1) The most important chart feature is the trading range. Long trading ranges represent zones where supply and demand move into balance.
a. Ranges are zones where strong hands / smart money accumulate new shares if they are bullish, or distribute existing shares if they are bearish.
b. In early November price attempted to break out of the top of the range, but failed. In Wyckoff terms this is known as a terminal upthrust. The failure is bearish and confirmed the view that the range represented distribution.
c. The upthrust was followed by a high volume decline back to the lower bound. The volume expansion and solid thrust strongly suggested that price was likely to break out of the trading range.
d. There was some buying as the market tested the bottom of the range for the last time (note the very low volume bounce). My interpretation is that traders who had repeatedly bought the trading range lows, tried to buy again. They failed to recognize the significance of the upthrust and of the development of high volume in the days just prior. Now they are trapped.
2) On Friday, price fell through the range lows, trapping longs and accelerating lower on high volume.
3) Was the volume high enough to exhaust the immediately available supply? I would think not. Modern selling climaxes often take multiple days to unfold, and are not likely to occur this soon after falling out of a long zone of distribution. Remember, the long range attracted many weak handed buyers who are now being forced to liquidate.
Targets:
1) There are several ways to think about move objectives. The simplest is to run a Fibonacci retracement of the March 2020 low to the November 2021 high. I keep it simple. I look at .382, .500 and .618.
2) Note that the 50% retracement of the entire move is very close to the January 2020 high pivot. The two form a support confluence in the 169 zone. Given the amount of distribution that occurred in the trading range, I think its more likely that the .618% retracement @ 152 is the most likely one.
3) When a correction develops you will be able to use the TradingView trend based Fib extension tool to project additional targets. Its likely that those targets, combined with the retracement tool and more traditional chart analysis will provide support confluences to work with.
Point and Figure charts also provide insight. They don't get nearly the respect of Fib points, but they deserve it. I tend to use the Fibo points as my references, but sometimes, a solid PF range count can add insight.
Wyckoff and others taught that the length of time spent in the consolidation is related directly to the distance of the subsequent move. Trading ranges are areas of the chart where large amounts of shares change hands, often from strong hands to weak hands. This is why there is a relationship between the length of the range and the size of the move.
1. Granted, there is no end to the debate as to what points should be used to define the counts. Since I'm a simple guy, I keep it simple.
2. In this case the width of the range is notable. A conservative target falls in the 145 area while a more aggressive accounting measures as deep as 121.
So I have targets, what do I do now?
1. I think its enough to know that the targets are all much lower. As the trade progresses the chart will produce more support and resistance zones, target and objectives that will help to narrow the range of outcomes.
2. The final point is that, particularly in the case of point and figure charts, objectives are more guides than they are precise points. When available P&F counts are extremely useful in determining risk/reward in a trade.
In the shorter run, the market broke out of its trading range on Friday with a solid daily/weekly thrust lower. But now, in the shortest perspectives it is deeply oversold. If the market does rally, the character of the rally is likely be corrective. I like to look for bear flags or pennants or a rally back to the underside of the broken trading range before the market rolls over again.
Final Point: I was always taught to buy the strongest names/groups in uptrends and to sell the weakest names/groups in downtrends. IWM has clearly been weaker than SPX for a number of months. The top panel is IWM, the middle panel is the SPX and the bottom panel is the ratio between the two. If the market is setting up a major correction IWM probably will be far weaker than SPX.
Good Trading:
Stewart Taylor, CMT
Chartered Market Technician
Shared content and posted charts are intended to be used for informational and educational purposes only. The CMT Association does not offer, and this information shall not be understood or construed as, financial advice or investment recommendations. The information provided is not a substitute for advice from an investment professional. The CMT Association does not accept liability for any financial loss or damage our audience may incur.

Russel distributing (correlates with Bitcoin)Russel is distributing. Looking back, it correlates with BTC since the covid crash. Will BTC break out of it's trading range to the downside?

IWM 195/190 Put Credit SpreadSimple trade idea here. 1 month out, >10% RoM (Return on Margin) This one was filled at 0.55 credit, allowing for commissions on the way out to be covered and keep the 10% return.
I did not love that this was moving downwards still, but we are near the bottom of the range and this trade gives us 8% or so of room. Management rules will still apply. close at 50% profit, or -200% of credit received.

$IWM, trading it 1/24over 203 205-206.5 possible
under 196 192.5-194 possible
#intradayoptionstrading #stockmarket
NO bias, read red or green day. chop/ranging = hand sitting
