BTC/GOLD Comparison instead of USDIs it possible that bitcoin already bottomed if you compare it to Gold instead of the Dollar? Is the 4 year USD cycle broken? Did BTC bottom to gold because of the Gold run? Will the cycle play out exactly the same it did in the past or did something change due to the end of the 18.6 real estate cyc
Related indices

BTC/GOLD will bottom hereJust a couple more months of chop and pain for crypto before the up-only resumes again
This happened back in May 2021

BTC Gold - BKC Charting ExampleBare Knuckle Charting BKC is something I developed (And still developing) over the years.
I will use this chart to give you a crash course in BKC.
Here is the original post I made back in March to follow along. )
So, BKC, let's start with:
1. Always start with a plain chart.
2. 99.9% of the time

BTC/NASDAQ DO OR DIE LEVELBTC/NASDAQ DO OR DIE LEVEL.
If Btc/Nasdaq ratio can not hod this red line in the sand then we will have potential death spiral for BTC over the next few quarters possibly years. BTC MUST MUST!!! bounce from here

Netherlands Crypto Tax Plan Targets Unrealized Gains From 2028The Netherlands is preparing a major change to its tax system. Lawmakers are likely to approve a proposal that would tax both realized and unrealized capital gains, including gains from cryptocurrencies, starting in 2028.
Reports from local sources suggest a parliamentary majority supports the plan.

BTC Long Term TrajectoryThis is a long-term weekly (1W) logarithmic chart of Bitcoin market capitalization with a multi-year rising regression channel drawn over the entire history.
Here’s what it shows, structurally and conceptually:
1. Log-Scale Secular Growth Channel
The blue shaded channel represents Bitcoin’s logar

AI Bubble pop = Crypto SeasonAlso looking like a bottom on the BTC/Metals pairs. A perfect storm coming!

BTC vs Silver: Is This a New Major Bottom?1️⃣ BTC/Silver at Channel Support = Where Big Bottoms Formed Before 📉➡️📈**
- Every time BTC/SILVER touched the bottom of this rising channel, a major bottom followed:
- 🦠 Covid crash → huge recovery after
- 🐻 Bear‑market low of the current cycle → next bull phase started
- 🔁 Today the rat

BTC vs GOLD: Falling Channel Bounce Setup1. What we’re looking at
Price is inside a downward channel.
We just tapped a big support zone (grey box) that also lines up with the lower channel line => strong confluence.
2. Trade idea 🧠
Look for bullish reaction in the grey box (wicks, strong green candles, RSI/volume confirmation

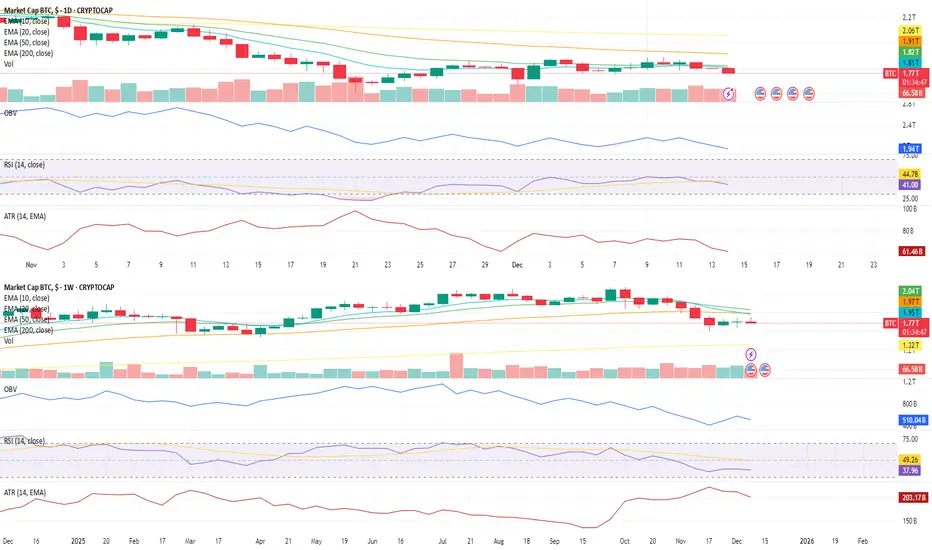
BTC Structure Update — Daily & Weekly View1D Chart (Daily)
Bitcoin’s short-term structure remains under pressure, with price trading below the 20 EMA, which is currently holding flat and steady rather than accelerating. This suggests a market that is pausing rather than aggressively trending.
EMA structure: Price below the 20 EMA, with th
See all ideas
Displays a symbol's value movements over previous years to identify recurring trends.