Bitcoin No Math — Lover’s Pulse (BTC/WM1NS):the trend line fits like a vein, not a ruler. Bitcoin’s fractal feels like it breathes hugging the trend line like a lover.
Trade ideas

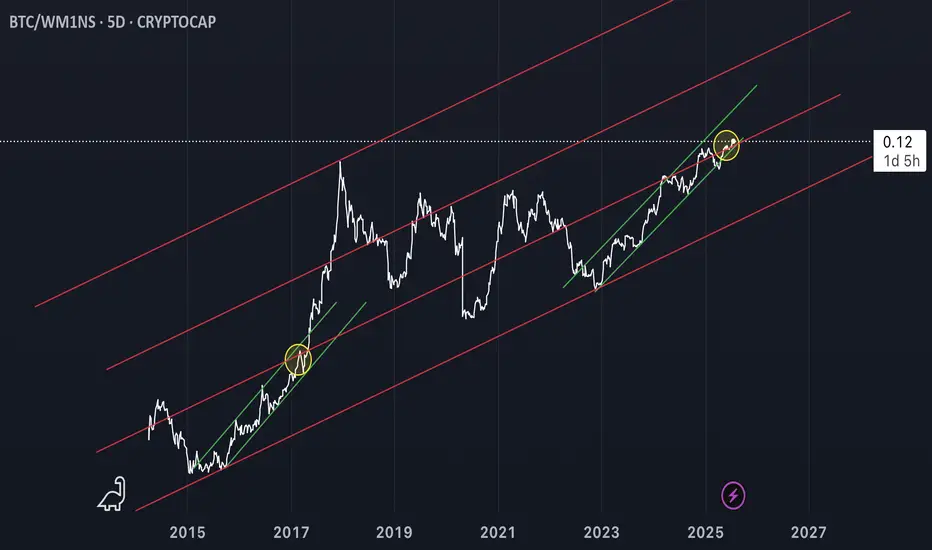
Bitcoin Location Road AtlasSimple Bitcoin is Mid-Cycle. Based on historical fractal behavior. BTC/WM1NS

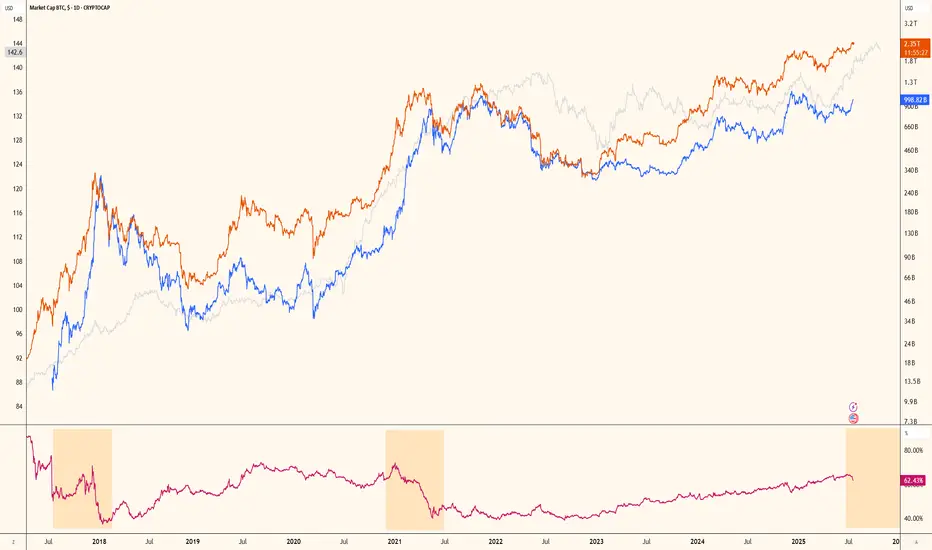
Bitcoin’s Triple Cycle Overlap“Bitcoin’s Triple Cycle Overlap” reveals three distinct, self-reinforcing rhythms in Bitcoin’s price history:
• 4-year cycle (red) — tied to halvings, driving short-term bull/bear phases
• 8-year cycle (blue) — reflecting adoption waves and institutional entry
• 13-year cycle (green) — capturing Bitcoin’s long-term maturation from niche asset to global reserve
These cycles are not random — they are fractal, consistent, and overlapping across time, with the 2025–2029 window marking the first full convergence of all three.
— Created by @drednaught0moto

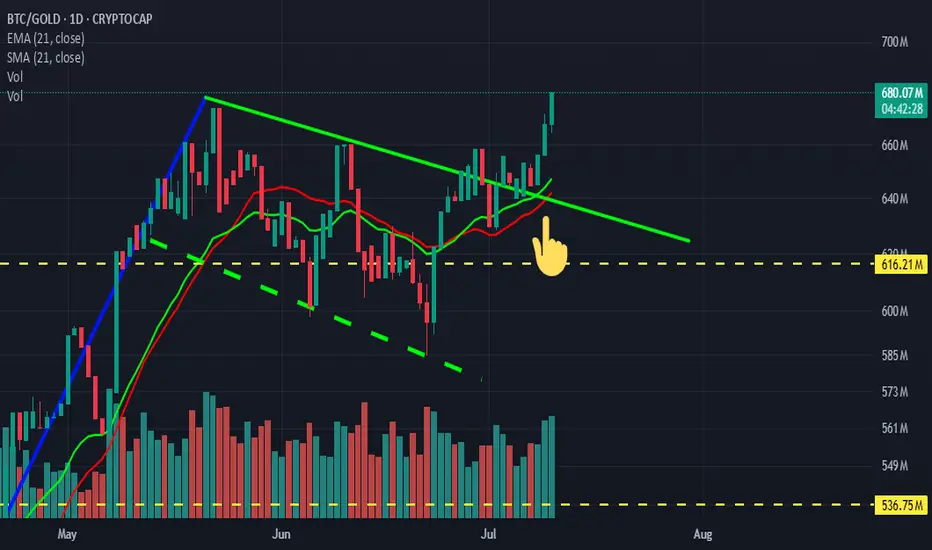
BTC/GOLDThe BTC/GOLD ratio just broke a multi-week descending trendline and pushed above a tight moving-average cluster, signalling trend transition from compression → expansion.
Momentum and breadth indicators have flipped bullish; this could be the onset of a 6–9 month relative outperformance cycle for BTC vs. gold if the breakout holds on higher-timeframe closes.

$BTC Bottom soon? Expanded flat?CRYPTOCAP:BTC appears to printing wave Y of a running flat correction (or expanded flat)
The rules?
X pokes above all time high on a large 3-wave move and is often rejected even harder.
Y ends above W, if it goes below it is an expanded flat instead and likely ends just below W. Same outcome….
Also the daily 200EMA, macro support trend-line, High Volume Node support and a pop lower could give hidden bullish divergence in daily RSI.
Daily RSI often does not make it into oversold on Bitcoin.
Safe trading

$BTC Double Top - Business Cycle & Global Liquidity Analysis TWIN PEAKS 🎄🌲
How the Business Cycle Supercharges Liquidity (and Crushes Cycles
Many of you may remember my BTC cycle thesis I wrote ~1.5 years ago. It was based solely on technical analysis covering previous cycles and did not take into account macro conditions such as global liquidity and the business cycle.
While that has been a guiding light to get me to this point, after further macro analysis, my views have changed a bit.
Based on my technical analysis, a price target north of $200k remains for CRYPTOCAP:BTC , but I now believe we will see some sort of a DOUBLE TOP like we did in 2021; this time in mid-December 2025 and late-March / early April 2026.
The December 2025 top will fulfill the “4-Year Cycle prophecy” which has been fueled by the current boom in global liquidity.
Whereas the March / April 2026 top will come from a booming business cycle (measured by the ISM PMI); something we have yet to see.
As you can see in the 2017 and 2021 cycles, the business cycle cues Alt Season.
I don’t think we see a real one without it.
That’s where people spend the money they made through safer assets such as Gold > Stonks > ₿itcoin etc.
We saw Altcoins, NFTs, Sports Cards, Sneakers, Watches, Collectibles etc go parabolic during this time in 2021. And it just so happened that the market for a lot of these high-risk assets topped around that time.
Here's a link to a Michael Jordan rookie card in PSA 9 condition that peaked around February 2021 right before the business cycle topped.
www.psacard.com
I think Altcoins went on for a bit longer after the business cycle topped because they were native on-chain and had less friction to transact (crime season anyone?).
NFTs saw sustained speculation because of the novelty and innovation they were bringing to the space. NFTs should act more like traditional risk assets this time around, and top slightly after the business cycle.
THE FURTHER WE ARE IN THE BUSINESS CYCLE, THE FASTER LIQUIDITY REACHES RISK ASSETS.
Think about it… everyone and their mother are making a ton of money from a booming business cycle ie hairdressers, uber drivers, personal trainers etc and dumb money finds high-risk assets near instantly. We see this with an uptick in google searches, youtube views etc.
This is why global liquidity with a 10-12 week lead overshoots cycle tops in the past.
An immense amount of Global QE in 2021 created an outlier for a continued pump in liquidity, even after the business cycle topped.
Then in the bear market, liquidity deviates from risk assets again as money moves back to safe havens first such as GOLD, which is a near 1:1 injection, and we see ₿itcoin lag by 10-12 weeks.
We should continue to see large caps do well for the remainder of the year as money slowly rotates out of BTC into ETH, SOL, BNB etc, but small caps don’t start to outperform until the business cycle starts convincingly rising well above 50.
Alternative investments such as sports cards are starting to see a similar rotation. Michael Jordan is the ₿itcoin of sports cards, and many of his cards are well above 2021 all-time highs. Other high-end cards from GOATs such as Tom Brady, Mickey Mantle, Wayne Gretzky etc continue to shatter prior records.
NFTs are also starting to see a resurgence with high-end collections such as Crypto Punks, X-Copy etc.
I’m not completely sure if the first or second top will be higher for CRYPTOCAP:BTC yet, but I’m leaning towards the first one in December.
The aforementioned riskier assets should get the lion’s share of business cycle capital in March / April.
At this nexus we will see the Treasury General Account refill suck liquidity out of markets due to tax season. TGA refills have marked previous tops in 2017 and 2021, so I see no reason for this time to be different.
Yes, this will be a much shorter business cycle, which is caused by a historic amount of money printing during the pandemic. The outcome left the US economy in a high-inflation / high-interest rate environment.
The business cycle represents Main Street, and it is clear that the aftermath of the pandemic has crushed middle and lower income households.
~FIN~
JK
POST REFERENCES:
-The 4-Year Boom and Bust Cycle is by design
-Synchronized Bear Market Bottoms
-If you want to dive deeper into the current macro landscape, you should definitely read the playbook I wrote ~10 months ago. It’s been playing out near-perfectly.

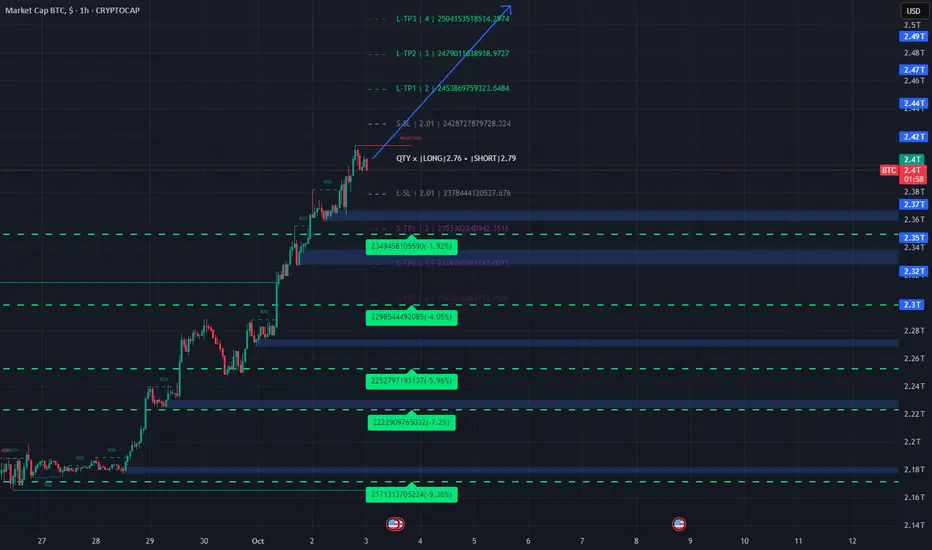
BTC Market Cap – Bearish Channel Reversal Setup (1H Analysis)Chart Context:
The chart shows BTC market cap moving within an ascending parallel channel, with price recently reaching the upper boundary resistance and starting to show signs of weakness.
📊 Key Levels
Entry Point: 2.46T
Stop Loss: 2.49T
Target (LABA TARGET POINT): 2.33T
Current Price: ~2.44T
🔍 Technical Breakdown
Ascending Channel:
The BTC market cap has been trending upward within the blue channel, respecting both upper and lower boundaries.
Rejection at Upper Channel:
The price touched the top boundary near 2.49T and began consolidating — a classic signal for potential downside correction.
Bearish Setup:
The shaded red zone represents a short setup:
Entry near 2.46T (retest of structure resistance).
Stop loss above channel top (2.49T).
Target towards 2.33T (lower channel / support zone).
Risk–Reward Ratio:
Estimated around 1:4, making it a favorable short setup if confirmation (e.g., bearish candle or structure break) appears.
Volume & Momentum:
Momentum seems to be slowing; lower highs and flattening volume often precede corrective moves in such setups.
🧭 Conclusion
Bias: Bearish (short-term correction expected)
Trade Plan:
Wait for a small retracement or retest near 2.46T before entry.
Stop loss: above 2.49T.
Target: 2.33T (LABA zone).
Invalidation: A breakout above 2.49T would invalidate this short setup and could push BTC market cap toward 2.52T+.

Title: BTC/USD: Breakout Confirmed - Targeting $135K After SucceBitcoin has decisively broken and closed above the major resistance level of $120,000. Following a clean and successful retest of this level as new support, the structure confirms a strong bullish breakout.
The momentum is now building for the next leg up, with all signs pointing towards a challenge of the next significant target.
🎯 Primary Target: $135,295.5
🛡️ Major Support (Buying Zone): $118,043.66
The overall structure suggests Bitcoin is gearing up for a significant continuation pump.
BTC Dominance ForecastComparing the BTC.D to USDT.D
The BTC.D is currently bullish while the USDT.D is bearish.
From experience, both moves are 90% of the time opposite and from current analysis of BTC.D, the expected drop is perceived to be around $1.48 trillion down from the current level or at most $2.48 trillion level.

Gold -> BTCGold is heavy, slow, and infinite to mine — Bitcoin is light, instant, and forever capped at 21M.
Portability: You can send it globally in minutes; gold is heavy and slow to move.
Divisibility: Bitcoin can be split into tiny fractions; gold can’t easily.
Scarcity: Bitcoin has a fixed supply (21M); gold’s supply can still increase with mining.
Transparency: Supply is verifiable on the blockchain; gold requires trust in reserves.
Gold wins in tangible history and physical use, but Bitcoin wins in speed, accessibility, and certainty of scarcity!


Bitcoin now on 2017 supportNot a chart I’ve shared before. Previous historical resistance in 2017, is now support. (BITCOIN divided by M1. BTC/WM1NS)
The Final Turn Before the Altcoin RotationAs Bitcoin continued its rise, altcoins couldn't keep up. This isn't the first time; the market has experienced this many times. The general pattern is as follows:
1. Global liquidity increases, providing a kind of spark to the market.
2. Bitcoin catches fire, and a bull market begins. If global liquidity increases during this time, great.
3. For various reasons, altcoins don't rise at the same pace as Bitcoin, and therefore Bitcoin's dominance begins to gradually increase.
4. When the market reaches saturation, dominance declines, leading to a rotation into altcoins.
5. The altcoin market capitalization equals Bitcoin's, and the bull market begins.
We're currently at a stage where Bitcoin's dominance has peaked and liquidity is still rising. The beginning of a decline in dominance will trigger a market rotation. This will trigger a capital flow into altcoins, bringing their market value equal to Bitcoin's.
Therefore, we're at the final plateau before entering a bull market. A further rise or hold in Bitcoin is expected. I'm currently buying altcoins, but I'm holding Bitcoin. I don't have a sell mindset at the moment.
Bitcoin Breaking out against goldLooks like the sentiments from the Crypto Tariff meeting were positive,
Bitcoin breaking out against gold, 3 green candle pump of the 21day.
xD
Waves*Standard deviation extensions from the completed waves (blue)
Expecting a 1-1 harmonic move higher here (pink). Not much else to say about this idea, other than the potential for other waves to happen that could invalidate this wave count but thats always a possibility.
The current count is all textbook EW wave counts for the sub-waves, but my own extended wave structure for the major fractal (largest 5 wave sequence).

BTC VS M2 Total Valuation at alltime high supportanother way to look at the macro picture
BTC claiming an all time high ratio of monetary supply
I wonder if anyone else pays attention to this? idk worked for the bottom

BITCOIN market cap 5 waves up ENDING NOWSo the chart posted is Bitcoin market cap which matches the same wave count in the Bitcoin I have moved to a full short BITCOIN look for a rather big abc down back to .618 best of trades WAVETIMER

REANALYZING BTC Like mentioned in my previous share, this is the reanalysis.
BTC still hold a very strong bullish trend. With it being an appreciative asset, every bearish trend is wisely considered a retracement. The recently broken trend is characterized by multiple weaknesses.
With the fact that it respected the 50% retracement level to break the bearish trend + the bullish strength, gives the bulls an upper hand.

BTC Dominance + Stables approaching key resistance BTC Dominance + Stables approaching key resistance (72–76%) — historically a top signal before altseason rotations.
1️⃣ Dominance nearing peak
The BTC dominance index (including stables) is pushing into the historically critical zone.
Past peaks in this area have often marked local BTC tops followed by altcoin rallies.
2️⃣ Why it matters
When BTC.D + stables stalls at the top, it often signals that capital is ready to rotate into altcoins.
A final BTC push without alt response = classic trap before liquidity flows into riskier assets.
3️⃣ What’s the plan?
🎯 If BTC.D spikes into 75–76%, we’ll begin aggressively accumulating altcoins.
Key confirmation = BTC stalling & dominance reversal.
Until then: observe and let the market come to you.
Final thought:
Altseason doesn’t start with hype — it starts with rotations.
Watch the dominance chart closely. The setup is forming.

Trading Crypto Currencies using the stock market derivatives.There are now over 40 Bitcoin ETFs that you can use for long term investing, trading for monthly income, to diversify, to mitigate risk, or for safe-haven investments. BTCs are a Stock Market Derivative. There are numerous derivatives that are available in the stock market. Every other financial market has derivatives that have been developed by Dark Pool Buy Side Institutions as well as Derivative Developers.
The stock market is the safest and easiest of all the financial markets to trade. It is simple to learn the market participant groups a who is leading price up or down.
The stock market provides everything you need in the most straight forward and simple buy or sell format.
There are 8 financial markets which now includes crypto currencies in the US financial markets. The Buy Side Giants have been accumulating Bitcoin for several years now, as they recognize the potential of crypto to help investors and traders diversify or have another type of trading instrument they can use for monthly income.

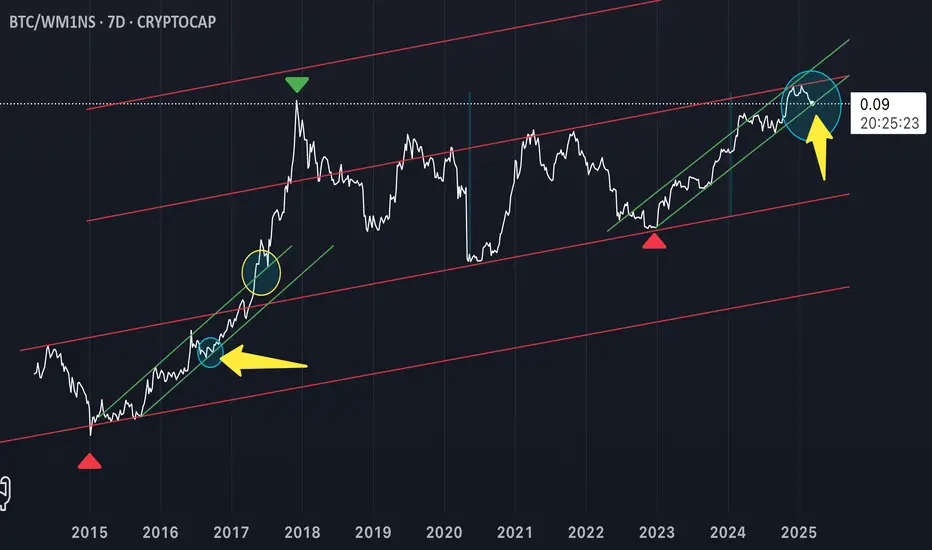
Squawk! Bitcoin Longer, Larger, and Exponentially Growing Cycle!Squawk! Bitcoin Longer, Larger, and Exponentially Growing Cycle!
Bitcoins market cycle is expanding, lasting longer than most anticipate! As price channels widen over time, the scale of each move grows exponentially, extending both the peaks and the troughs! It’s Squawktasticly bigger!

Where is Bitcoin?Squawk! Currently Bitcoin is at the 2nd yellow arrow! Compare to the first arrow for the roadmap my Squawky friends!