Bitcoin Bitcoin ranging between 45337.27 resistance level and 34428,28 support level.Currently trading at 40574,86.
Trade ideas

Bullish Optimism in BTC HistoryHello to you,
When I first looked at a chart, it was back in 2003, when the cheapest indicator used to cost $500. EasyForex was my very first broker. They now go by EasyMarkets; they recently joined Tradingview. They are great.
So, it's been a long time ey, and I strongly advise you to avoid signal services and trade-school programs that will mostly cost you money in the long run. Account management services and the gathering of trading groups are all "lucky -luck" for you if you will get the right one.
I'll tell you something: there is no such thing as a resume in retail trading. Your years of experience are irrelevant to a moving candlestick. This is how it is put "Past performance is not indicative of future results". What that means is that when an Electrician says he's an electrician, he's more serious in his work than an analyst who boasts about guessing future prices.
And those Financial Bank Institutions with professional traders: they use technology, scripts, they even have software developers dedicated for them. So :) BTC looks bullish.
*Never treat a chart set-up like a trade, but as a means to approach a trade.
.
Khiwe
On this profile page, the shared analysis, ideas, and strategy of a chart belong to Khiwe, with some being influenced. The technical setups are speculative; they are not guaranteed for accuracy or completeness in the form of any content, and they are not intended to provide financial market advice. Please apply your own analysis and confirm it with price action.

BTC Market CapWhat do you think about the BTC Market cap.
We can still expect the price to complete H&S by retesting either one or two support(s).


Ukraine Legalizes Bitcoin (BTCFor the Ukraine, sentiment towards Bitcoin (BTC) and the broader crypto market has been more favorable. Back in September of last year, the government had introduced a crypto bill only for the Ukrainian President Volodymyr Zelensky to veto it shortly afterwards.
The Bill, legalizing and regulating Bitcoin, only had 6 votes against and 276 votes in favor. According to the Kyiv Post, the President vetoed the Bill and sent it back to Parliament for changes. President Zelensky cited a lack of funds in the budget to meet the regulatory oversight requirements of the Bill.
The previous bill had stated that “the virtual assets market would be regulated by the Ministry of Digital Transformation, the National Bank of Ukraine (NBU), the National Securities Commission (NSC) and a new independent regulatory body that would have to be created“.

Bitcoin (BTC) Price Prediction: BTC/USD Holds above $39K SupportOn February 17, the bears succeeded in breaking below the $41,800 support as BTC price attempts a rebound. The breakdown signals the resumption of a downtrend. In retrospect, the largest cryptocurrency has been range-bound between $41,800 and $45,000 price levels. The bulls made several attempts but failed to break the $45,000 overhead resistance. Sellers have regained temporal control of prices as BTC/USD declines.
Resistance Levels: $70,000, $75,000, $80,000
Support Levels: $50,000, $45,000, $40,000

Whale entry point in bitcoin and dollar chartsA simple analysis of the dollar and bitcoin charts says that everyone is waiting for a divergence and looking for a leap upwards

BTC/ETH levels to watch.. 10/22BTC/ETH is now around 1/2.2, or 10/22.. from past performance, it looks like this level can hold max 9-10 month. Feb-2022 is 8th month.

BTC dominance vs Top Altcoins - Bullish scenario - Possible?Hopefully this scenario happens and top altcoins gain vs their BTC pairs. Might go down vs USD but I'm happy if I make more BTC.

BTC Market Cap Falling Wedge BreakoutBTC marketcap has been forming a falling wedge (bullish breakout pattern) since its recent highs in October and November 2021. This pattern was broken with the dip to 33k, but mcap has recently re-entered the wedge and broke out this morning. I would expect at least 40% increase of BTC market cap, or around $1 Trilion.

BTC/Crypto market - Cyclical analysisSome quick comparisons to last cycle and this cycle,
Timing compared to last cycle shows we are in the date range for the bear cycle to be confirmed.
Points of similarity's:
-Halving may have significant impact in timing to reach ATH again
Points of difference:
-Last cycle didn't have as large of a 'false bottom'.
-Confirmation of bear for last cycle was on month 3 (%70 drop). We can see confirmation by the end of this month, maybe even next month.

DEFLATIONLook through charts relating to the DEFLATION inflation paradigm
No one talking about deflation (except Auntie Cathie)
Every man and his Pug talking about INFLATION
Everyone BTFD
Is it really that simple?
GRI 2022

Tell Me What's Wrong With This ChartThe answer is that it's probably not bullish enough.
Bullish divergence on the MACD
Bullish divergence on the RSI
Looking suspiciously like the END of a boring W4 correction
W5 corrections are usually the steepest
Most of my models point to major volatility after March, but there may be upside in BTC into the summer?
For now, the accumulation phase has ended. It was good while it lasted for those latecomers who wanted a fair shot. Not for those who bought at the top with no conviction.
Be careful out there and check my last post for the short term wave structure out of the bottoming pattern on BTC.

BTC & XRP correlation part 3.Will bottom hold?
We are in the critical moment, trough should hold if not then we should expect more move to the down side.

Btc price divided by inflationI have seen that is a nice trend analysis, before my chart blocked , I found the dip with this trend , and we see triangles from macroperspective , I am waiting for price action comes to inside of triangle

Bitcoin's Intrinsic Value
As per CoinMarketCap, 18.9 million Bitcoins have already been mined and are in the circulating supply.
In total, at least 3.7 million Bitcoin or about 20% of all BTC currently in existence are most likely gone.
BTC intrinsic value = $ 52 236
A Possible scenario is shown in the chart.

The flippening is a go, ETH>BTCWhen yellow hits zero, they are equal market cap. You can see in this chart how ETH & BTC find resistance against each other. However one is trending up and one is trending down...

BTC Market Cap AnalysisPlease zoom out to see all the ups and downs.
If the green trendline cannot hold, then things will get so ugly.

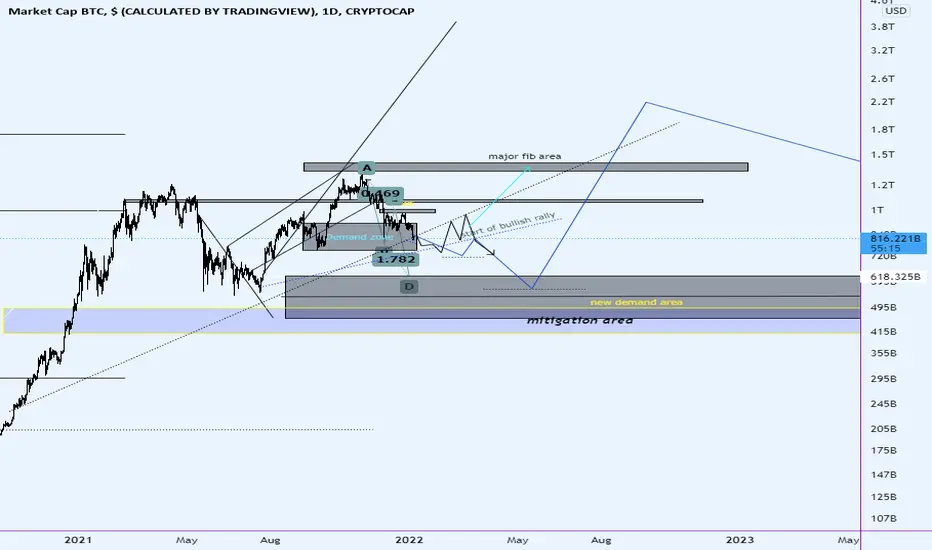
This summer will be an amazing time to buy bitcoin!Patience brings profits in this analysis I dissected best areas to get active in a major way. Through a fractal understanding of the market if you know how the 3 scenarios I drew go then we can take that knowledge down to a 5,1 min chart and operate off of the same bases and bank some huge profits. This is not financial advice, I draw my charts like this in order to prepare for volatility, like if you agree!
Btc adjusted for inflationBtc value accounting for overall supply of dollars and their purchasing power

ETH market cap is 10% down against BTC since Dec2021 ATHETH market cap is 10% down against BTC since Dec2021 ATH. Looks like above 50% of BTC market cap ETH is facing severe resistance.

WILL BTC RISE OR FALL?? Touching major resistance level.Strategy says BUY (Day Chart). However, price now hitting major resistance level. Will it continue to rise or continue down trend? Lets see.... I'm waiting for confirmation.

BTC Market Cap (Time to resume the bullish momentum)This is the weekly timeframe of BTC market cap, as you can see the BTC often bounce off the trendline which acts as an support. Base on this, i feel BTC is gaining dominance as we reclaim back 1 trillion market cap for BTC. As history data proven, during the period where we count down to end of the year, it's gonna be bullish for crypto market.
BTC Market Cap
