BTC/ALT POTENTIAL FURTHER DOWNSIDE Will we see further retracements in BTC (blue) and the ALTs (yellow line shows alt market cap minus BTC and ETH) before or around the halving? The green line allows us to look back 4 years to the previous bull cycle and pinpoint price action/market structure changes. Of course, looking at previous price action and market structure doesn't always have a high degree of predictive power, but it can act as a guide to temper your emotions and prepare for outcomes that may go against the current sentiment. And patterns do repeat. Again and again... ad infinitum....
Following this technical analysis (which of course may not materialise) on the logarithmic scale, we would see a drop, in market cap, of 30%, in BTC to the trend line...and circa 50% in the ALTS (not including ETH) to its respective trendline. If ETH is included (not shown) with the ALTs, then ALTs would see a 20% drop to the respective trendline. If this does materialise, then this would likely form the foundational strength for the next bull run through 2024/2025.
Trade ideas

Historical Support & The Beggining the Bitcoin Market Cap could be another indicator of when the bull run of 2024 will start.

Total Mcap Crypto bottom at 600billion pivot Lets see what we get here in price action as btc tops out locally and looks for support


BTC/SPXBTC market cap / SPX gives up comparison between relative performance of BTC and SPX.
It has been following the trendline since 2015.

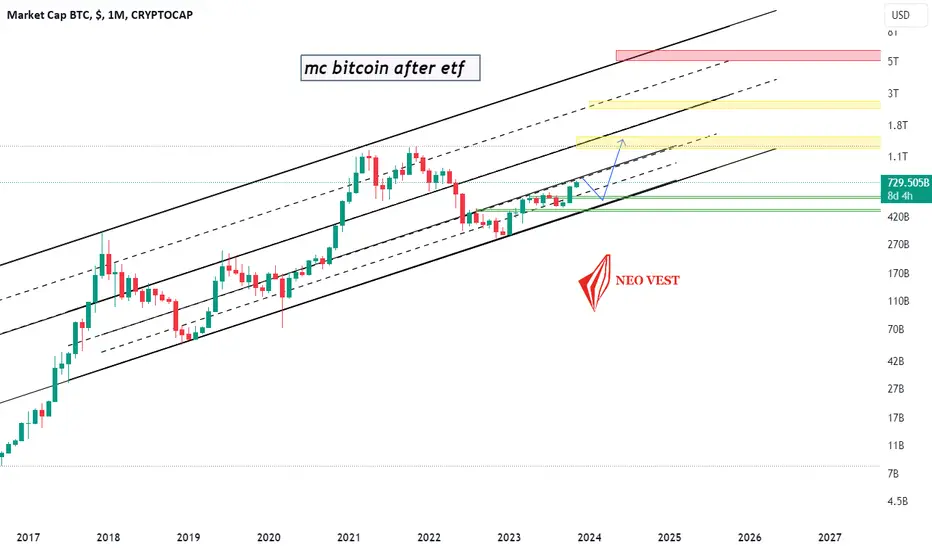
The market cap of Bitcoin is at the ceiling The market cap of Bitcoin is at the ceiling
and in 2024 will fall to near the previous floor
@JalilRafiefard
December 22, 2023

BITCOIN MARKET CAPThe market needs CAP to BO 44K
Expecting Bitcoin consolidation or healthy pullback
Needs smart or fresh money for the market to start trending again
coins that did not make 52WH by now are the losers
other that did will be good runners in the new cycle.

BTc bsv on top of the BTc market capBtc market cap priced in btc with an over lay of btc and bsv (priced in u.s dollars)

BTC/USM2 Monthly SuperTrend IndicatorBTC/USM2 money supply chart is typically more accurate to identify key price action than BTC/USD - 1st monthly candle to flip Supertrend line green on Monthly timeframe. Also punching through Ichimoku cloud…will history repeat and Bitcoin goes sideways for the next year ? Or will ETF continue price action straight up? Maybe 2024 will gift us a black swan to scoop up more cheap sats in a flash…

Are we currently at a local top for BTCCurrently this indicator is suggesting a local high for bitcoin as such divergences were displayed Around the TOP and BOTTOM of the previous cycle.

BTC Analysis and sample tradeBTC is at currently at the top of a bear channel which formed after a high displacement move to the downside. It is also at a bearish Order block. Sample trade I took with a high R:R. I take trades the second they conform with my idea and do not wait for any confirmation because I would rather take a small risk and high reward trade then wait for confirmation and take a low R:R trade. It is a game of probability after all.

Last BTC IdeaIt's been a pleasure exploring such a unique financial asset class. Nevertheless, we are moving into a political & economic direction in which crypto cannot coexist with the financial system and have any value in the long term.
There are many reasons for this outlook. Join my channel for more:
Telegram: @DeltaS7

[UPDATE BTC] BItcoin/M1 vs GOLD. Do you see it?M1 has caused problems for us BROTHERS. The current market divided by M1 resembles the gold market during a bear market, but it is happening three times faster due to the digital age. Based on this model, BTC may reach 35,000$ in 2023, undergo consolidation until the halving, and then drop to 8,000$ before beginning a new macrocycle.
It is important to note that this is only one of my models and should not be taken as definitive.

BTC market cap prognose 10.2023using some past time analisys trying to predict some future targets. however past performances don’t indicate the future ones


bitcoin dom and potential alts seasonDespite many people are saying that we're close to an alts season, I strill strongly believe that most altcoins will continue to suffer compared to Bitcoin.

BTC Market CapCRYPTOCAP:BTC as you can see btc market cap has been reached to its support line and we expect to grow from this area. i think btc has potential to reach around 40k soon.

Bitcoin 8.6.23Is Bitcoin bottoming out against Gold as it tests the demand line. As long as its in the channel it remains fully bullish. Under it and above the pivot is still bullish but leaning neutral. Any consecutive monthly close under and its likely GOld rips to new ATH or stays flat as the rest of the risk on market melts down.

Bitcoin At the 3-day time frame, the 50-period moving average is currently crossing above the 200-period moving average, with the closing price positioned above this crossover, indicates the possibility of a golden cross formation, a significant event that traders and analysts interpret as a signal of an upward trend in the market.
'The golden cross occurs when a short-term moving average crosses over a major long-term moving average to the upside and is interpreted by analysts and traders as signaling a definitive upward turn in a market.'

The Korean Financial Services Commission held a meeting on virtuThe Korean Financial Services Commission (FSC) held a consultation meeting on enhancing the compliance capabilities of virtual asset operators, expressing support for strengthening the compliance capabilities of virtual asset operators and resolutely cracking down on illegal activities. The Korea Financial Information Analysis Institute and the Virtual Asset Crime Joint Investigation Team , five major virtual asset exchanges and DAXA executives participated in the meeting.

BTC MA 200 crossed over MA 50 so Wait for CrossI wanted to bring your attention to a significant development in the BTC market. On July 23, we witnessed the Moving Average (MA) 200 crossing over the MA 20, indicating a potential shift in market momentum. While this may seem exciting, I urge you to exercise caution and consider waiting for a new buying cross before entering the market.
Experienced traders understand the importance of staying informed and making well-informed decisions. Technical indicators like moving averages provide valuable insights into market trends and can help us identify potential buying or selling opportunities. The MA 200 crossing over the MA 50 is often considered a significant event, suggesting a possible shift from a bearish to a bullish trend. However, it is crucial to approach such situations with a level-headed mindset and consider the broader market context.
Given the current market volatility and uncertainties, it is advisable to wait for a new buying cross before considering a classic BTC market entry. While the MA 200 crossing over the MA 50 may indicate a positive shift, waiting for confirmation and additional signals supporting a sustained upward trend is essential. Rushing into the market without proper verification could expose us to unnecessary risks.
In light of this, I encourage you to closely monitor the market and monitor the price action following the MA 200 crossing. Exercise patience and wait for a new buying cross to occur, providing more vital indications of a potential upward trend. We can minimize risks and make more informed trading decisions by waiting for confirmation.
Remember, successful trading requires a cautious approach and the ability to analyze market conditions objectively. While the MA 200 crossing over the MA 50 may generate excitement, remaining patient and waiting for a more reliable buying cross is crucial. Doing so can enhance our chances of entering the market at a favorable point and achieving better trading outcomes.

My first IDEA for BTC is how it will move in the coming daysMy first IDEA for BTC is how it will move in the coming days
