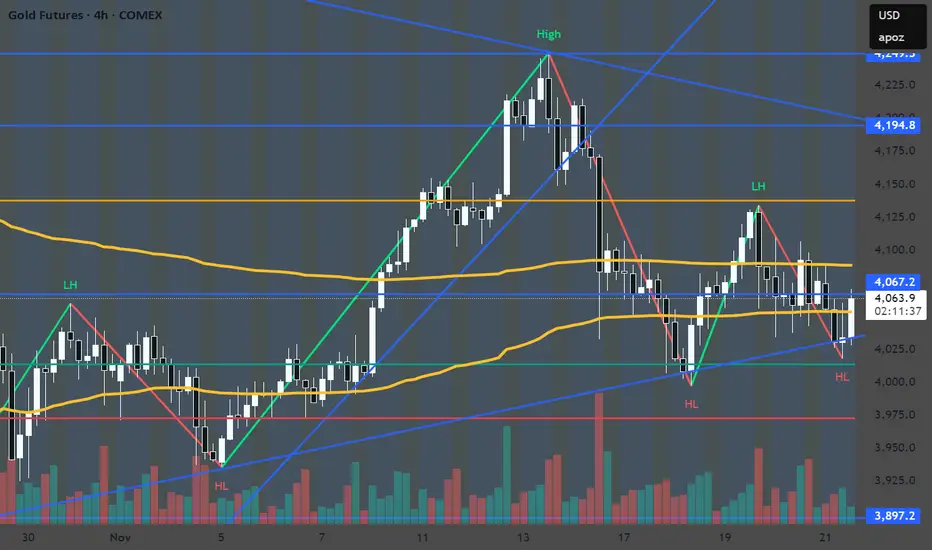
Triple Top - Double Bottom. Go Next Golden Shift4125 for a potential reload (supply area). 4275 - to make it all back.
Gold Futures
No trades
Market insights

Silver: A Sell Signal?COMEX: Micro Silver Futures ( COMEX_MINI:SIL1! )
What happened to the silver market? A previous all-time-high (ATH) record of $49.95 per ounce was set on January 17, 1980, and stood for 45 years until silver broke $50 in October 2025. Since then, silver prices kept climbing nonstop and setting new ATH records almost daily. Last Friday, November 28th, silver reached $56.86.
COMEX Silver Futures ( AMEX:SIL ) locked in an impressive 98% return year-to-date, which makes silver the top performer across all major asset classes year to date.
The strength of silver is supported by a confluence of factors including inflows into bullion-backed ETFs and expectations of a potential Federal Reserve interest rate cut. Investors rotated assets out of stock amid recent market weaknesses, benefiting the safe-haven assets gold and silver. In addition, gold purchases have slowed in recent months due to the record high prices. Some investors may choose silver as an alternative hedging asset.
However, a key metric suggests that the tide is about to change.
A Refresher:
In my writing published on April 28th, I introduced the Gold-Silver Ratio, a financial term that measures the relative value of gold to silver. The Gold-Silver Ratio may be used as a buying or selling signal.
When to Buy Silver : A high Ratio, typically above the 95:1 mark, suggests that silver is undervalued relative to gold. This is often interpreted as a buying signal for silver.
• Recalling that in the April 28th writing, we explored the idea of buying silver at $33 when the Ratio stood at 100. Silver prices went up 72% since then.
When to Sell Silver : When the Ratio is low, say around 80:1, it indicates that silver is relatively expensive. Investors might consider selling silver and buying gold.
• As silver caught up with gold with its recent rally, the Ratio is declining all the way down to 74. This is a level indicating silver is very expensive relative to gold. From a mean-reversing point of view, the Ratio may rebound back to the 80-90 range soon.
In my opinion, gold could show more strength compared to silver in the new year.
• Global central banks have slowed gold purchases recently. Gold getting expensive did not cause the pause. Annual budget depleting may be a more plausible reason. A new year comes with new budget, and I expect central bank buying to resume in 2026.
• Silver is part precious metal and part industrial metal. Global GDP in 2026 is projected to slow to 2.9% to 3.1%, with downside risks from geopolitical tensions and trade policy uncertainty, according to the IMF. Industrial use of silver could slow as well.
• Expectations of Fed rate cuts are rising. The stock market could rally again, causing investors to rotate money out of safe-haven assets. In my opinion, gold could stand its ground better than silver, with central bank purchases serving as a key support. In this scenario, the Ratio rises because silver falling faster than gold.
Trade Setup with Micro Silver
Traders could apply the insights from the Gold-Silver Ratio with trading strategies using COMEX Micro Silver Futures ( AMEX:SIL ). There are a number of reasons why shorting silver makes sense:
• Traders expect mean-reversion of the Gold-Silver Ratio will occur soon.
• Investors expect Fed rate cuts to be bullish for stocks and bearish for precious metals.
• Traders with portfolio of spot silver or silver ETF want to hedge their positions.
The big advantages of using futures contracts are capital efficiency and leverage. Micro Silver contracts have a notional value of 1,000 troy ounces of silver. With Friday settlement price of $57.455, each January contract (SILF6) has a notional value of $57,455. Buying or selling one contract requires an initial margin of $4,000 at the time of writing. This suggests a built-in leverage of 14.4 (= 57455/4000) for futures contracts.
By putting a deposit equivalent to 70 ounces, traders could gain the full exposure of 1,000 ounces of silver. If silver prices move down by 10%, a short position in Micro Silver futures would gain 144% (= (57455*0.1) / 4000).
Micro silver futures (SIL, 1000 oz) and standard-size silver futures contracts (SI, 5000 oz) contracts together form a deep liquidity pool. On November 28th, SI had trade volume of 109,967 contracts and an open interest (OI) of 155,222 contracts. SIL had volume and OI of 79,015 and 14,900 contracts, respectively, according to data from CME Group.
To hedge the risk of rising silver prices, a trader could set a stoploss on his short-silver order. For illustration, a short order is executed at 57.455 with a stoploss at 59.0. If silver goes up 10% to $63.2, the maximum loss will be $1,545 (= (59-57.455)*1000), well within the margin account balance of $4,000.
Happy Trading.
Disclaimers
*Trade ideas cited above are for illustration only, as an integral part of a case study to demonstrate the fundamental concepts in risk management under the market scenarios being discussed. They shall not be construed as investment recommendations or advice. Nor are they used to promote any specific products, or services.
CME Real-time Market Data help identify trading set-ups and express my market views. If you have futures in your trading portfolio, you can check out on CME Group data plans available that suit your trading needs www.tradingview.com

Gold holding trendline push towards 4194 possibleA Long position towards 4194 is likely as we see that this trendline holds firm.
Gold/Silver Ratio - Monthly Close on Bear FlagExpect higher moves in Silver as it hits new ATHs, i expect gold to have a sympathy rally alongside Silver, however the break in the gold/silver ratio to the downside (silver outperforms) would signal a higher % move in Silver to follow.

GOLD (XAU-GC) BUY PLAN📊 Market Sentiment
Market sentiment for GOLD remains strongly bullish. One of the key drivers is the aggressive accumulation by global central banks. Recession concerns and persistent inflation fears continue to position gold as one of the most attractive safe-haven assets.
📈 Technical Analysis
Price has completed the expected accumulation phase and broke out strongly from the accumulation range. This former range has now turned into a clear demand zone. Price has pulled back into this zone again and is currently testing the $4060 level.
📌 Game Plan
The $4060–$3900 zone is my primary buy zone. I will continue accumulating within this range.
My first target is $4250, followed by $4400, which aligns with new all-time-high expectations.
If price closes below $3900 on the daily, this idea becomes invalid. Therefore, my stop is a daily close under $3900.
💬 If this breakdown aligns with your outlook, like and comment below.
For deeper sentiment and strategy insights, subscribe to my Substack free access available.
⚠️ This analysis is for educational purposes only and does not constitute financial advice. Always conduct your own research before trading or investing.

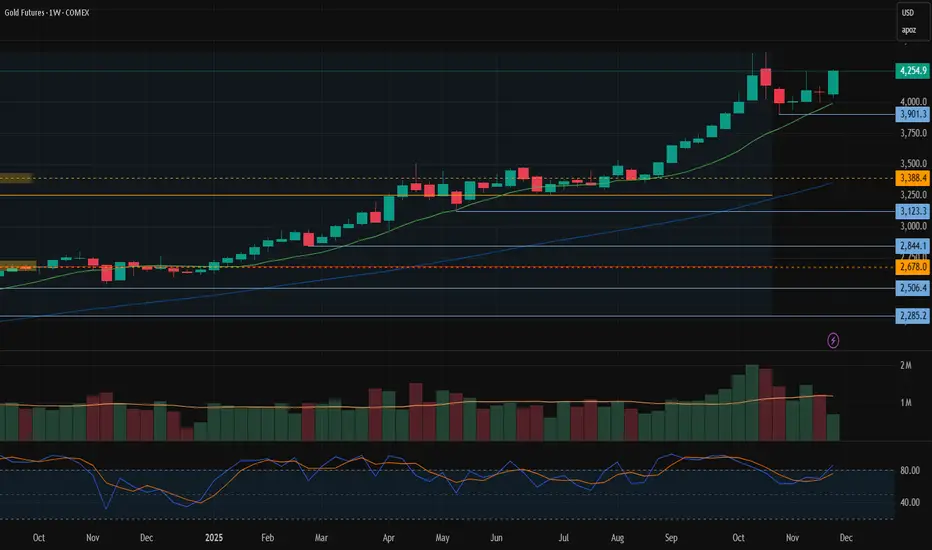
Gold futuresOver the past four weeks, gold futures fell to the 3900 level, before resuming their upward move. They may be now be preparing to retest the all-time high at 4400. Formally, the trend remains bullish, however, from a historical perspective, it has already lasted for more than 1000 days, leaving limited room for further upside.
Long-term trend: Up
Resistance level: 4400
Support level: 3900
GOLDGold right now is still and inside bar in the monthly chart. The weekly chart just hit TP1 off a 22 strat combo to the upside. We are waiting to see if price will have enough strength to continue to go outside on the month or will we stay inside? I'm ready for either let see what she does

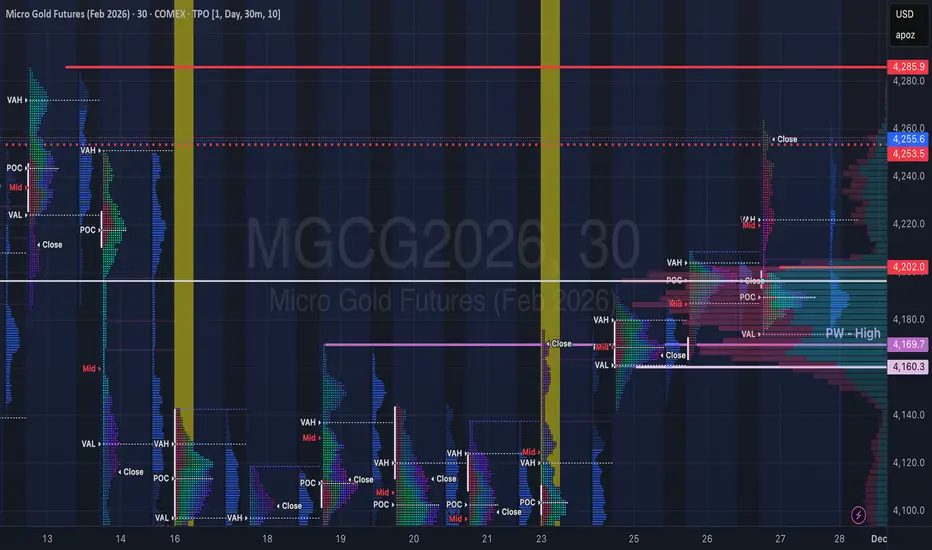
Gold Context: December Open & Holiday Inventory CheckCOMEX_MINI:MGCG2026 COMEX:GC1!
Traders. Here is the context update as we transition into the new month.
Market Context (Holiday Drift): The auction drifted higher on thin volume during the Thanksgiving and Black Friday shortened sessions. This extension was largely driven by a lack of sellers rather than aggressive buying, leaving us with a "thin" structure.
Structure & Inventory: We have significant inventory resting back at 4200 – 4170, sitting just above the Previous Week High (PWH).
Current Action: Price is holding the holiday extension.
The Problem: The move up lacks heavy volume support. We have "unfinished business" below at the breakout zone.
Plan & Execution: Monday marks the start of fresh December flows. I am not interested in chasing this extension at these highs.
Stance: Flat / Patient.
The Test: I want to see Gold rotate back to test the inventory at 4200 – 4170 first.
Decision: We need to verify if buyers will defend this zone (turning old resistance into support) before committing to a new directional bias.
Talk to you for the next update.
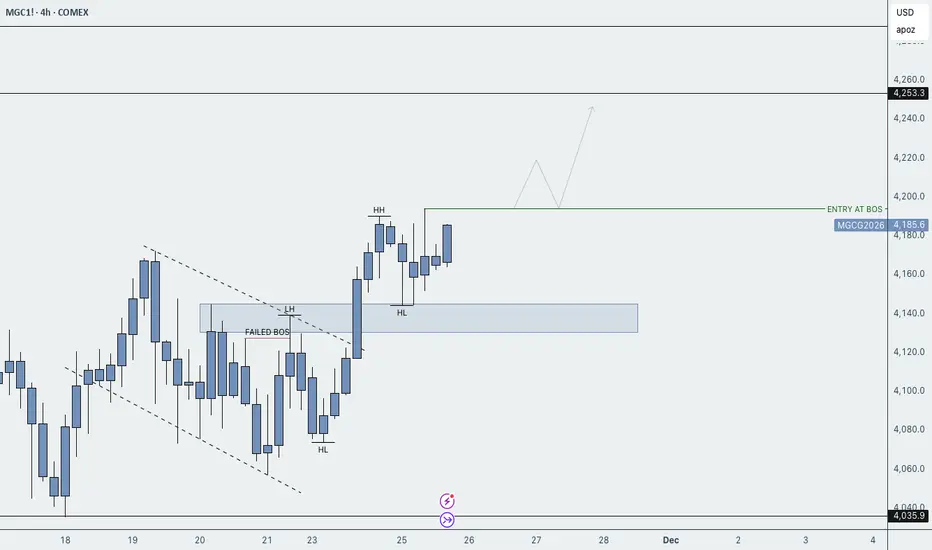
1H Rally-Base-Rally Long Setup | Weekly & Daily AlignedMarket structure remains bullish across the higher timeframes with the Weekly, Daily, and 1H all trending upward. I’m focusing on the most recently created valid 1H Rally-Base-Rally demand zone for a potential long entry.
This zone is high quality because it:
✅ Removed opposing supply zones
✅ Broke a valid trendline on departure
✅ Shows strong impulsive buying pressure
✅ Is the most recent institutional demand on the 1H
Plan is to wait for price to return into this zone for continuation with the higher-timeframe trend. As always, patience and risk management first no chasing price.

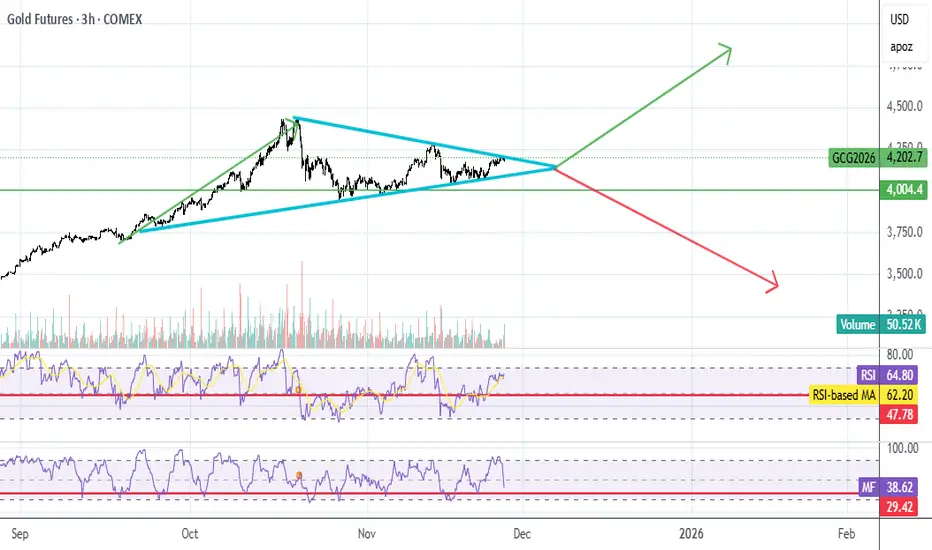
You don't see that everyday 3 triangles -beautiful to watch. I think this is a continuation of the main trend up ,it's latter stages of the rally so very short term indeed.

MGC Long Setup – 15M WOW Demand Aligned with 4H & Daily Trend15M WOW demand has formed from a trendline break, showing a shift in order flow.
Even though the 15M structure is currently bearish, the 4H and Daily trends remain bullish, keeping the higher-timeframe bias to the upside.
Entry plan:
• 15M demand wick entry
• Or refined entry using 1M nested demand
This is a lower-timeframe entry aligned with higher-timeframe continuation.

MGC ShortElite analysis
Shorting from 4h structural liquidity zone> 1m TS, 3m TS, 5m TS confirmed. Executed Short.
Targeting lower liquidity pools. 1st Session low, 2nd 4h bottom structural liquidity zone, grey rectangle.

Gap up on GC- Big gap up on the opening
- Left behind an low volume zone
- Quite over streched the daily
- Looking for short term downside

GOLD/ SILVER RATIO - Quarterly FlagBeautiful looking quarterly flag present on the gold silver ratio, should this break down, which would be likely to play out over the next 12-18 months (at most) then expect much higher silver prices.
I would expect to see the ratio hit between 50-30 should this flag pattern materialize.

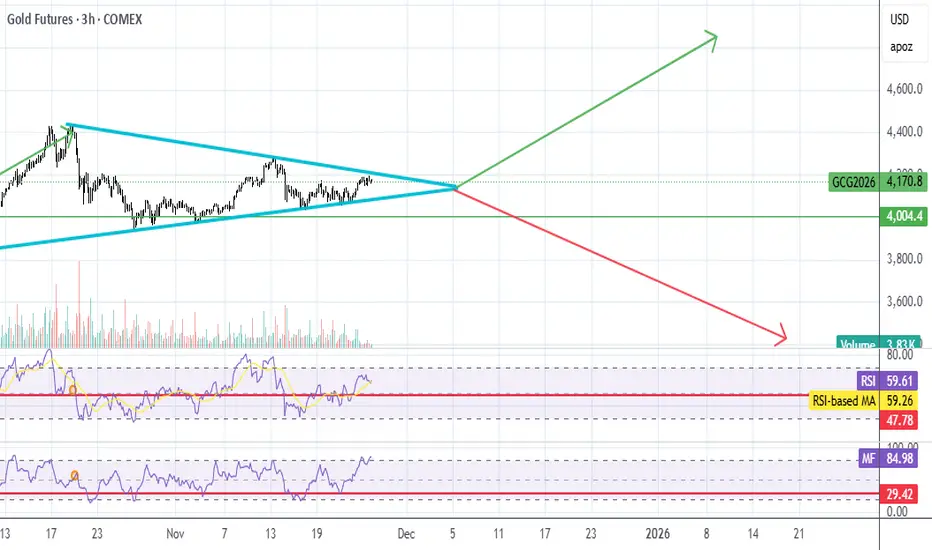
GC UpdateMFI hasn't quite hit oversold, but it looks like it's melting up out of the pennant. Went long on Dec 26 GLD calls, going for a longer term strategy this time, so I'm not just cycling when MFI goes oversold on the 3 hr.
With longer term calls, it's not a big deal if it does dip.
The Truth About Timeframe Analysis – Chapter 2FAFO – F*-AROUND-FIND-OUT FRAMEWORK”**
If timeframes misalign, the market punishes you — every single time.
1️⃣ Trend / Impulse Check
Last impulse >2× previous → momentum, not trend.
Momentum alone = FAFO
Check last candles → volume continuation or fade
Context decides survival.
2️⃣ Zones Only Count With Confluence
Align with:
✔ Trend
✔ HTF
✔ Clean break/retest
✔ Rejection candle
✔ Multiple TFs clean
No confluence = decoration, ignore.
3️⃣ Candles = Evidence, Not Setups
Single candles ≠ signal
Must fit context + confluence
Wrong context → FAFO
4️⃣ Confluence = Survival
2 variables aligned + 1 neutral = potential
Any contradiction = dead setup
No guessing. No opinions.
5️⃣ Timeframe Conflicts → Wait
H1 bullish, M15 bearish → NO TRADE
Waiting = capital protection, not inactivity
Force a trade → FAFO
6️⃣ Context = Weapon
Strong trend + HTF resistance + fading volume = conflict → do not trade
Market shakes out amateurs here
Respect context or get cleaned
7️⃣ Golden Rule
Never trade against HTF unless MTF confirms reversal:
✔ Structure shift
✔ Volume shift
✔ Rejection candle
✔ Alignment
Trade anyway → RR small, execution precise
8️⃣ 10-SECOND CLASSIFICATION CHECK
HTF → bullish / bearish / conflict
MTF → aligned / challenging / opposite
LTF → entry / noise
Zone → fresh / retested / dead
Candle → supportive / neutral / invalidation
Confluence → 2 aligned + 1 neutral = tradeable
Contradiction → NO TRADE
9️⃣ FAFO Examples
Bearish M15 at HTF demand = FAFO
Momentum into dead zone = FAFO
Giant candle in consolidation = FAFO
10️⃣ Rule Stack
HTF owns the market
MTF decides opportunity
LTF executes only
Two variables aligned = potential
One contradiction = dead setup
Momentum ≠ trend
Zones need confluence or they don’t exist

MGC / GOLD 15/4h/D🧠 Multi-Timeframe Alignment – XAUUSD
Daily + 4H demand are in control ✅
15M structure is bullish ✅
Although price is currently high in the range, this 15M demand is valid because it just displaced and removed the opposing light red zone.
With lower timeframe confirmation and HTF alignment, I’m projecting price to continue higher and remove the 4H opposing zone.

Possible MGC BuyPrice broken structure and formed a HH:HL retesting the level. Momentum continued then stalled into consolidation, so I'm waiting for a break of the inside before I look to buy again.
GOLD directional trade with this week Analysis + ORB Pro entryGold is heading up to the previous OB. We are using our Rapid ORB indicator to entry. This a live update.

GC UpdateI probably should have gone long when it hit the bottom of the pennant. Waiting for it to come back down.
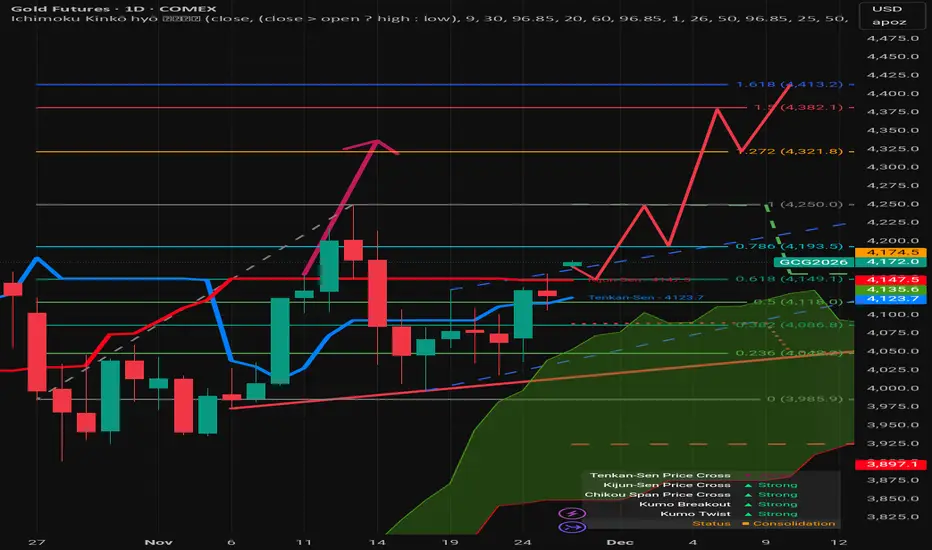
Recovery phaseFollowing a "Double Bottom," currently testing key resistance levels within a broader bullish context (indicated by the large green Ichimoku cloud).
The price has successfully reclaimed the 0.618 level (4,149.1). Holding above this level is crucial for the bullish thesis to continue.
The price is approaching the 0.786 level (4,193.5). A breakout here usually opens the door for a retest of the previous high.
If the price breaks the previous high (Level 1 at 4,250), the chart projects targets at the 1.272 extension (4,321.8) and the 1.618 extension (4,413.2).
The price is trading well above the Green Kumo (Cloud), which acts as a major dynamic support zone. This generally indicates a long-term bullish trend.
The Tenkan-Sen (Blue, 4,123.7) is currently below the Kijun-Sen (Red, 4,147.5), which is technically a weak signal. However, the current price (4,167) has moved above both lines, which is an early signal of renewed momentum. The status box at the bottom right notes "Status: Consolidation," likely waiting for the Tenkan to cross above the Kijun for a confirmed "Strong" buy signal.
A clear "Double Bottom" pattern formed around the 3,985 level (the 0 Fib line). This is a classic reversal pattern that provided the floor for the current rally.
There is an annotation for a "Bear Asc. Head and Shoulders." However, the price action has pushed up through the right shoulder, largely invalidating this bearish setup.
Current Move: A breakout from the consolidation zone between 4,080 and 4,150.
Short-Term Pullback: The projection anticipates a small dip or retest (likely bouncing off the 4,250 resistance initially).
Breakout: The projection implies a final surge breaking the 4,250 high, aiming for the Fibonacci extensions at 4,321 and 4,413.
Pivot/Support 4,149 (0.618 Fib) Must hold to maintain immediate bullish momentum.
Major Support 4,118 - 4,123 Confluence of 0.5 Fib and Tenkan-Sen. Loss of this level turns the trend neutral/bearish.
Key Resistance 4,193.5 The 0.786 Fib level; the next hurdle to clear.
Breakout Target 4,250 Previous High. Clearing this confirms the resumption of the macro uptrend.
Insight
The chart suggests a Bullish Bias. The "Double Bottom" provided a strong floor, and the price reclaiming the 0.618 Fibonacci level is a sign of strength. The primary risk is the "Consolidation", watch for the Tenkan-Sen (Blue line) to cross above the Kijun-Sen (Red line) to confirm the next leg up.
Upper zoneMight break out or break in to the zone on GC
Volume traded looks very thin on the upper level
We also filled in the gap from the sell off earlier this month.
