Oil - Change of CharakterOil is trading in a bearish trend.
I’m using Elliott Wave analysis to define key price levels.
The market is currently in an ABC correction and is approaching wave C at the 100% Fibonacci retracement.
The idea is that the market could reverse into a bullish trend and hit the previous high.
My entry is planned above that high level.
Oil Futures
No trades
Market insights

Will this be the final Defense from BUYERS to LIFT Crude ?NYMEX:CL1!
Becoming Profitable in the Auction, is a choice only chosen by the 'PROFITABLE'...
As of December 14, 2025, the (front-month) WTI crude oil futures contract (CL1) has declined by approximately 18% to 20% this year (year-to-date). Now currently we have a Daily Demand zone that ranges from $57.00-$55.00 p/b, will this be the final defense from buyers to lift the offer higher here in the auction or will sellers over power and tank the auction lower? There has been gr8 talks in the Energy Markets that Crude OIL is expected to go into a strong BULL MARKET PHASE starting 2026, what are your thoughts? Lmk in the comments...
Continued Success,
TreyHighPwr
#BHM500K

Bearish Sequence Pressures Oil (CL) LowerLight Crude Oil (CL) has decisively broken below the April 2025 low of $55.12. This breach confirms a continuation of the bearish sequence that has persisted since the March 2022 peak. The short-term decline from the October 24, 2025 high is unfolding in the form of a five-wave Elliott Wave impulse, which provides a clear structural framework for the ongoing weakness.
From the October 24 peak, wave ((i)) concluded at $57.10. The subsequent rally in wave ((ii)) developed as a zigzag Elliott Wave structure. Within this corrective phase, wave (a) terminated at $59.97, wave (b) ended at $58.28, and wave (c) advanced to $60.50. This final push completed wave ((ii)) at a higher degree, setting the stage for renewed downside pressure.
Oil then turned lower in wave ((iii)). From the termination of wave ((ii)), wave (i) ended at $58.08, while the rally in wave (ii) reached $59.05. The decline in wave (iii) is now progressing as an impulse of lesser degree. Within this sequence, wave i ended at $57.01, wave ii rallied to $58.19, and wave iii dropped sharply to $54.98. A corrective bounce in wave iv extended to $59.19, but momentum remains tilted to the downside. Near term, as long as the pivot at $60.50 holds firm, rallies are expected to fail in corrective sequences of three, seven, or eleven swings. This technical condition suggests further weakness ahead, reinforcing the broader bearish outlook for crude oil prices.

CRUDE OILDO YOU KNOW WHATS BEHIND THIS OR OTHER IDEAS?? in bio..
Preferably suitable for scalping and accurate as long as you watch carefully the price action with the drawn areas.
With your likes and comments, you give me enough energy to provide the best analysis on an ongoing basis.
And if you needed any analysis that was not on the page, you can ask me with a comment or a personal message.
Enjoy Trading ;)

Crude Oil MCX (4H) – Detailed Technical Analysis Trend
Short-term trend is bearish, with consistent lower highs under the falling supply trendline.
Key Zones
🔴 Strong Supply Areas
Ultra Strong Supply: 5400–5550
Immediate Selling Zone: 5280–5340 → Strong resistance. Price must close above this for a clear bullish reversal.
🟢 Demand Areas
Minor Demand: 5080–5150 → Expected short-term bounce zone.
Strong Demand: 4950–5050 → High-probability reversal zone if price drops deeper.
3️⃣ Price Scenarios
🟢 Bullish Scenario
If price holds 5080–5150 and breaks 5280–5340,
Upside Targets: 5350 → 5450
🔴 Bearish Scenario
If price rejects from 5280–5340 OR breaks below 5150,
Downside Targets: 5050 → 4950
4️⃣ Final Outlook
Market currently weak but near demand.
Sustain above 5340 = bullish reversal.
Sustain below 5150 = continuation downside.
⚠️ Disclaimer
This analysis is purely for educational purposes.
Not investment or trading advice.
Always use stop-loss and proper risk management.

Crude Oil Weekly Outlook: Inventory Pressure and 59.7 Key levelBackdrop: The Crude Oil Narrative
The tone in crude oil has been largely defined by a tug-of-war between demand uncertainty and controlled supply. OPEC has maintained its view that global oil demand should continue growing into 2026, but at a modest pace. Despite this, the group has acknowledged noticeable inventory builds worldwide over recent months. That dynamic alone has kept sentiment cautious and has acted as a headwind for sustained rallies.
OPEC+ has also chosen to hold off on further production increases into early 2026. Instead of expanding output, the group is now focusing on capacity assessments and quota alignment among members. This shift signals discipline on the supply side, but also suggests that the group is aware of potential oversupply risk if demand fails to firm up.
Markets have been responding to this mixed backdrop. On one side, controlled supply helps prevent severe breakdowns. On the other, rising inventories and uneven demand expectations limit follow-through on the upside. As a result, price discovery has been driven less by strong directional conviction and more by rotation between value areas, bid blocks, and responsive supply zones. Recent price behavior reflects traders waiting for clearer demand signals before committing to a trend.
What the Market Has Done?
At the end of September the market sold off but found support around the 60.17 area. That initial drop appears to have been triggered by worries about economic growth and a stronger dollar undermining demand.
At the start of October sellers stepped down and held the 62.3 level, which corresponds to the Composite Value area LVN. From that zone prices continued to sell off to 56.0 by mid-October. The continued selloff seems to reflect growing bearish conviction as macro data added to demand fears and inventories remained elevated.
Buyers began to accumulate again, forming bid block 1. From there the market auctioned prices upward back to the 62.3 area where sellers were still present and defended that zone vigorously.
From the last week of October up until the third week of November offers steadily stepped down as the market grinded lower, auctioning price down back toward bid block 1. Buyers responded by stepping up bids and holding the top of bid block 1 range. Throughout the last week of November the market balanced between 59.0 and 57.3, forming bid block 2 with clear buyer accumulation in that area.
In the most recent week, the market balanced between 58.4 (roughly the midpoint of bid block 2) and 59.82 (17 November weekly VPOC). This shifted the weekly value area higher. Last Friday, the market managed a close above the previous week’s VAH, suggesting that buying strength may be gaining momentum.
What to Expect This Coming Week?
The key level to watch is 59.7, which was last week’s VAH.
Bullish scenario
If the market holds above 59.7, anticipate a possible move up toward the 61.0 area, which corresponds to a daily level 1 and the weekly 0.5 SD high.
Expect sellers to possibly defend 61.0.
If price breaks through that zone, the next target is 62.3 (Composite Low Value Area), which is confluent with the weekly 1 SD high.
Bearish scenario
If buyers cannot defend 59.7, the market could drop back through last week’s value area toward 59.0 (previous week’s VAL), confluent with the weekly 0.5 SD Low.
Expect buyers to possibly defend 59.0
Should that support fail, price could move further down toward 58.0 (24 November weekly VPOC), which is confluent with the weekly 1 SD low.
Neutral scenario
If sellers respond at the 61.0 area or if buyers step up at 58.0, the market could balance here and potentially shift value higher as buyers accumulate.
Conclusion
In summary crude oil has been trading under pressure from macroeconomic headwinds and demand concerns while finding support at key zones. The market has rotated between zones and recently shows signs of buyer strength. The key 59.7 level will likely dictate whether price heads toward 61.0 or returns toward 58.0.
What’s your outlook for Crude this week? Drop a comment and give this post a boost so more traders in the community can join the discussion! Thank you.
Disclaimer: This is not financial advice. Trade responsibly and manage your risk carefully.

Crude Oil Sell around 59.00.target 58.00 to 56.00Crude Oil Market Analysis:
Recent crude oil price movements have been essentially free money; there's no easy analysis to follow. The key is to wait for the right entry point. Sell when the price reaches the expected rebound level. Conversely, as long as it doesn't break 60.50, it remains extremely weak. Crude oil is bearish, and short-term fluctuations don't change the overall bearish trend. Sell at 59.00 today.
Fundamental Analysis:
The Fed's interest rate decision was in line with market expectations. The rate cut didn't bring much surprise to the market, except for the official announcement of further rate cuts in 2026, which was somewhat unexpected. In the long term, this will weaken the dollar and support gold.
Trading Recommendation:
Crude Oil – Sell around 59.00, target 58.00-56.00

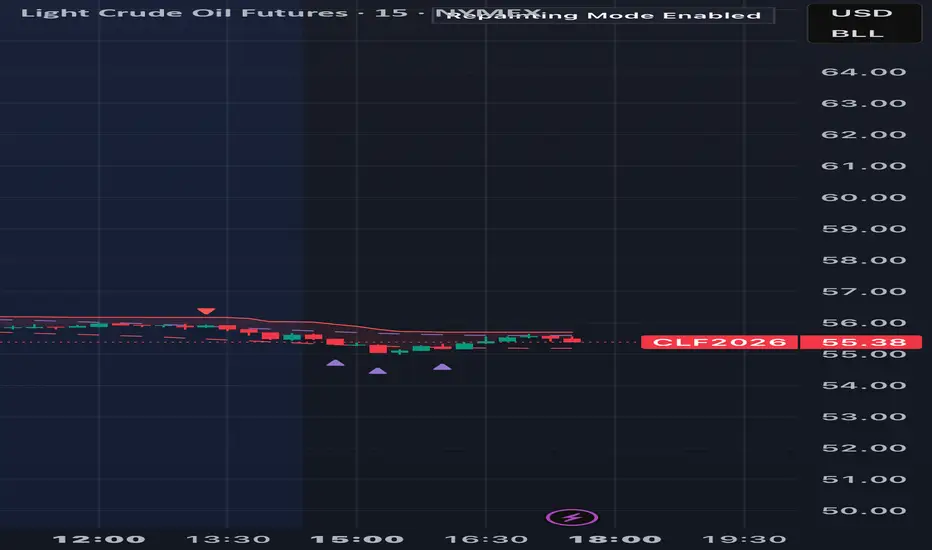
Crude Oil Showing Lower Rejection For NowCrude Oil Futures (January 2026 Contract) Analysis—4h Chart
Crude oil futures (NYMEX: CLF2026) are trading at $58.92 as of the latest 4-hour bar, showing a positive move of +$0.57 (+0.98%) for the day. Today’s session marks a modest recovery for oil, with prices ranging between a low of $58.31 and a high of $59.05.
Key observations:
After hitting our sell take profit zone this morning, the level was rejected. After dipping to the session low, prices rebounded to close just under the high, suggesting renewed buying interest.
Trend outlook:
With gains near 1%, short-term technicals suggest further upside if momentum continues. Watch closely for a break above $59.05 for confirmation.
Volatility: Intra-session swings remain moderate, but a move above or below today’s range could set the tone for the next direction.
Quick Take:
Crude oil remains sensitive to global supply cues and economic sentiment. Traders should monitor key resistance near $59.05 and support at $58.31 for breakout signals. Cautious optimism is warranted as oil seeks direction near these pivotal levels.
This is not trade advice.
#CrudeOil #Futures #TradingView #OilMarkets #TechnicalAnalysis

Compressed SpringRecent crude oil price action reflects a clear compressed spring phase, characterized by an extended decline followed by progressively narrower ranges, repeated lower wicks, and a lack of downside follow-through despite sustained selling pressure. This behavior points to supply absorption by larger market participants, as the market stops reacting to negative news and volatility contracts in an atypical manner. Technically, the accumulation zone is concentrated between 55–57, while the true trigger is a breakout and daily close above 60.30–60.60. A strong confirmation of a regime shift would be a sustained close above 62, a scenario that historically precedes fast, directional expansions rather than gradual moves, shifting risk away from further downside toward an abrupt bullish impulse.
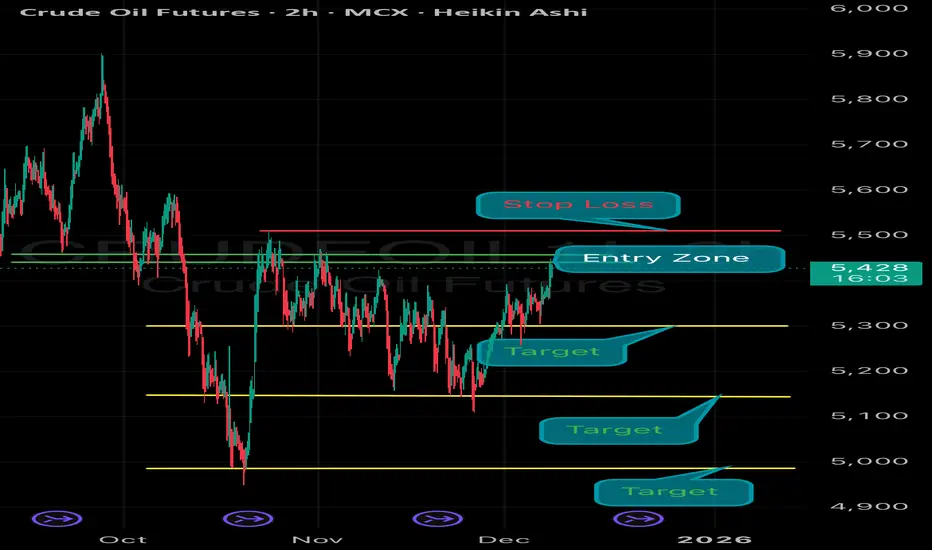
MCX Crude Oil Dec -Bearish Setup The chart has identified a Bearish Opportunity with a well-defined trade structure:
✅ Entry Zone: 5430 – 5440
🔒 Stop Loss: 5510 (Strict SL — no relaxation)
🎯 Target Zone: 5330 - 5200– 5100
⚠️ Risk Management Rule:
Once the trade achieves 1:1 Reward:Risk, immediately shift Stop Loss to Cost-to-Cost to secure the position and reduce downside exposure.
Stay disciplined. Follow levels precisely. 📊🔥
CRUDE OILDO YOU KNOW WHATS BEHIND THIS OR OTHER IDEAS?? in bio..
Preferably suitable for scalping and accurate as long as you watch carefully the price action with the drawn areas.
With your likes and comments, you give me enough energy to provide the best analysis on an ongoing basis.
And if you needed any analysis that was not on the page, you can ask me with a comment or a personal message.
Enjoy Trading ;)

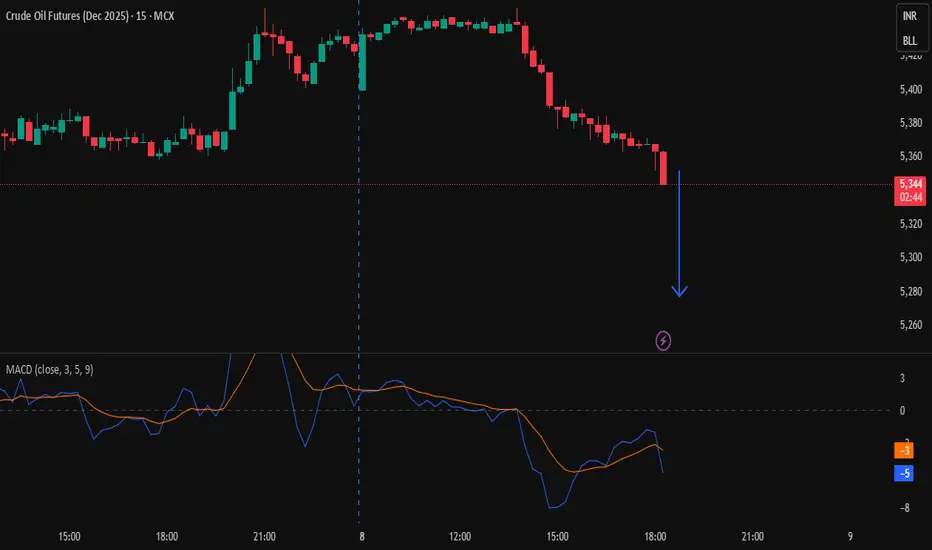
CRUDEOIL DEC 2025 FUTURESPrice making lower low and MACD making higher high and also MACD line if crosses below signal line, I thinks its going to be huge
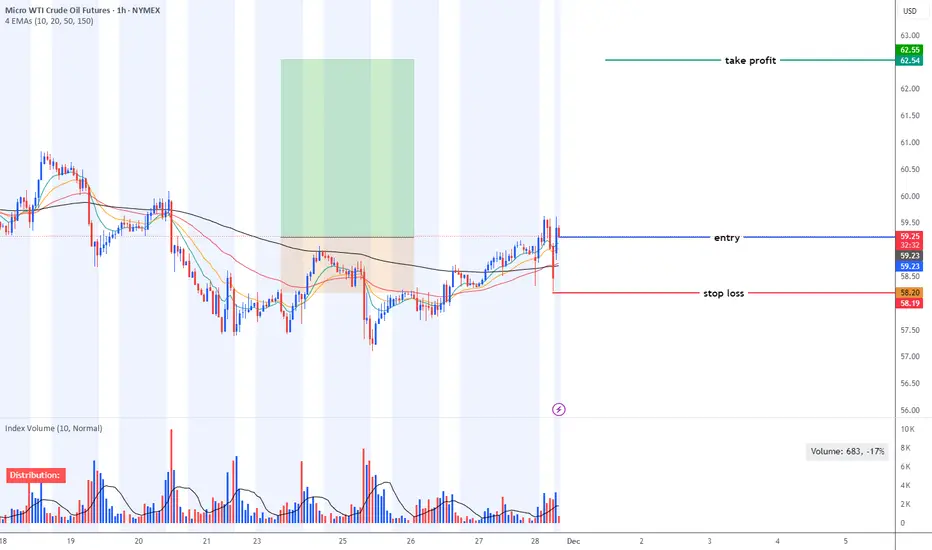
MCL - swing trade opportunity based on technical analysisMCL - swing trade opportunity based on technical analysis.
CRUDE OILDO YOU KNOW WHATS BEHIND THIS OR OTHER IDEAS?? in bio..
Preferably suitable for scalping and accurate as long as you watch carefully the price action with the drawn areas.
With your likes and comments, you give me enough energy to provide the best analysis on an ongoing basis.
And if you needed any analysis that was not on the page, you can ask me with a comment or a personal message.
Enjoy Trading ;)


Crude Oil – Sell around 58.60, target 56.00-55.00Crude Oil Market Analysis:
Given the recent sharp decline on the daily chart for crude oil, our strategy remains unchanged: sell on rallies. We've maintained a bearish outlook on crude oil for several months, during which it has remained relatively stagnant, trading within a narrow range. Today, we'll focus on contract settlement; wait for a rebound to around 58.60 to sell.
Fundamental Analysis:
Today's release of key CPI and unemployment claims data could significantly impact the market.
Trading Recommendation:
Crude Oil – Sell around 58.60, target 56.00-55.00

Bullish on OIL while everybody is bearishSee 3 touchs at $55.73 and it hold up
We'll see $57 or more

Short MCL 11.16.25 9pm 1hrBias: Bearish on 1H
Context: Pull back into Value after a bearish momentum.
Entry: Pull back into value, 1H, above 20ema
Stop: Above the previos high, 15min
Expectation:
RR:1:4 - 1.5

WTI has just lift from it's low$0.86 in 30 minute $55.14 to $55.9
What do you think it'll be at tomorrow ?
Close to $57 ?

Crude Oil at Key Short-Term Reversal ZoneCrude Oil – 15 Min Short-Term View
Crude Oil is currently taking support in the 5100–5130 zone and is trading near the lower band of a falling channel.
Reversal Scenario:
If the support holds, a short-term reversal towards 5180–5190 is possible.
Breakdown Scenario:
A decisive break below the support may lead to a move towards the major support zone at 4900–5000.

MCL | Wk 51T.A explained -
BackSide (BS)
FrontSide (FS)
Inverse BS (Inv.BS)
Inverse FS (Inv.FS)
BS & FS levels are expected support when dashed lines, tested when dotted and resistance when solid lines.
The inverse is true for the Inv. BS Inv. FS levels, they are resistance as dashed lines, tested as dotted and support as solid lines.
Monthly timeframe is color pink
weekly grey
daily is red
4hr is orange
1hr is yellow
15min is blue
5min is green if they are shown.
strength favors the higher timeframe.
2x dotted levels are origin levels where trends have or will originate. When trends break, price will target the origin of the trend. its math, when the trend breaks, the vertex breaks too so the higher timeframe level/trend that breaks, the more volatility there could be as strength in the orders flow in to fuel the move.
