CRUDE OILDO YOU KNOW WHATS BEHIND THIS OR OTHER IDEAS?? in bio.
Preferably suitable for scalping and accurate as long as you watch carefully the price action with the drawn areas.
With your likes and comments, you give me enough energy to provide the best analysis on an ongoing basis.
And if you needed any a
Sorry, this is only available to registered users
MCX provides data to our registered users only, so to get it you'll need to sign up for a TradingView account.
Related commodities

Crude oil probable price projection1. if price closes above the level then it moves up
2. if price breaks below may test lower levls

Crude Oil Has Finally Finished An Intraday Corrective SetbackCrude oil made a very strong rebound back in mid-October with an impulsive move of more than 11%, while the current retracement from 62 is very slow, which still suggests a counter-trend movement despite the weakness now retesting the 78.6% support levels. We can still see three waves down, and idea
CRUDE OILDO YOU KNOW WHATS BEHIND THIS OR OTHER IDEAS?? in bio..
Preferably suitable for scalping and accurate as long as you watch carefully the price action with the drawn areas.
With your likes and comments, you give me enough energy to provide the best analysis on an ongoing basis.
And if you needed any

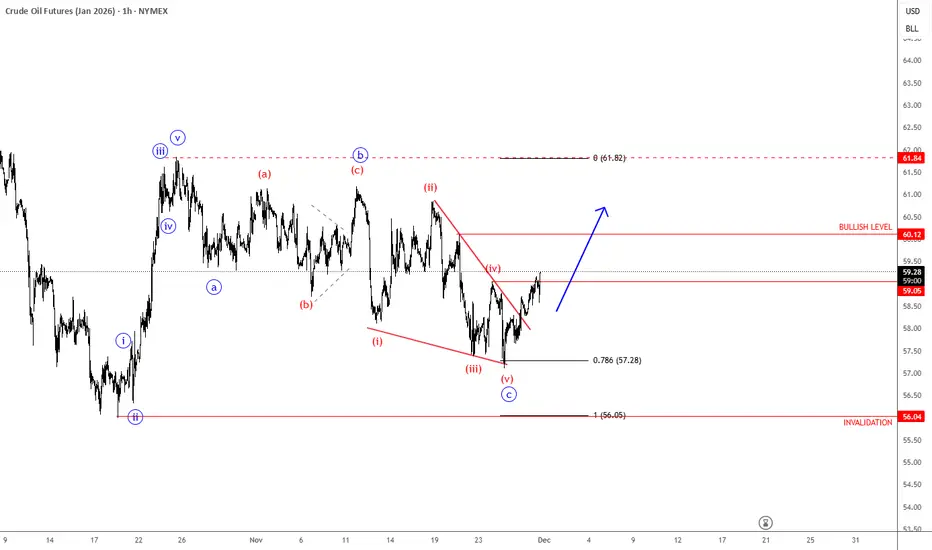
Crude Ready For New Strong Leg UpCrude oil is recovering for the last few weeks, after new sanctions against Russia, with price rebounding from 56 sharply and impulsively. This suggests an important new swing low is in place, and we should now be aware of more upside ahead, with a minimum three-wave recovery that could take us towa

There are some setups for trades todayThis is Monday the 24th and I went through a number of markets including oil which I think is going higher and they went to some many contracts for traders who need less risk even though there's a little bit less reward.

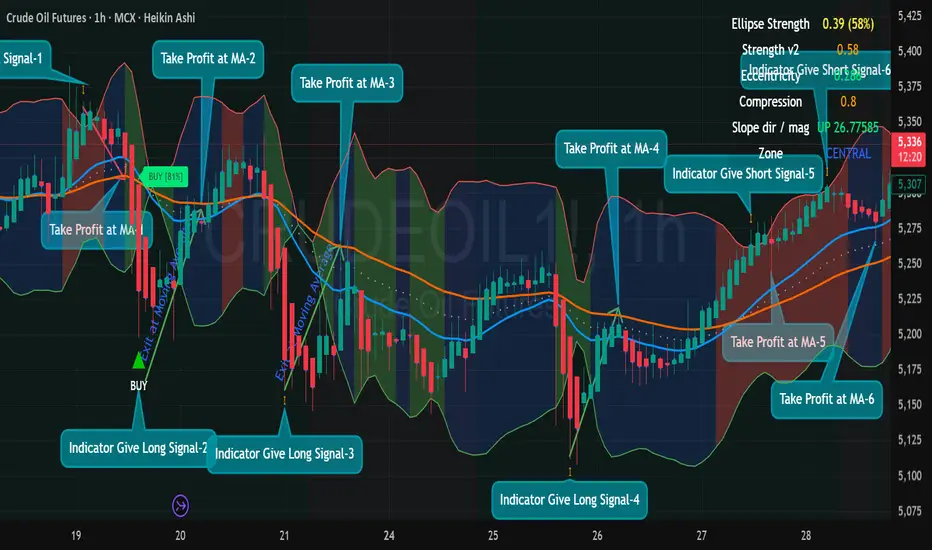
6 Back-to-Back Winning Trades Using Ellipse Price Action.6 Back-to-Back Winning Trades Using Ellipse Price Action Indicator (Crude Oil · 1H)
Ellipse Price Action Indicator captured 6 clean winning entries on MCX Crude Oil (1-Hour).
The system is simple:
✔ Indicator gives Buy/Sell Signal (Green/Red Triangle or Orange Arrow)
✔ Take entry only when price
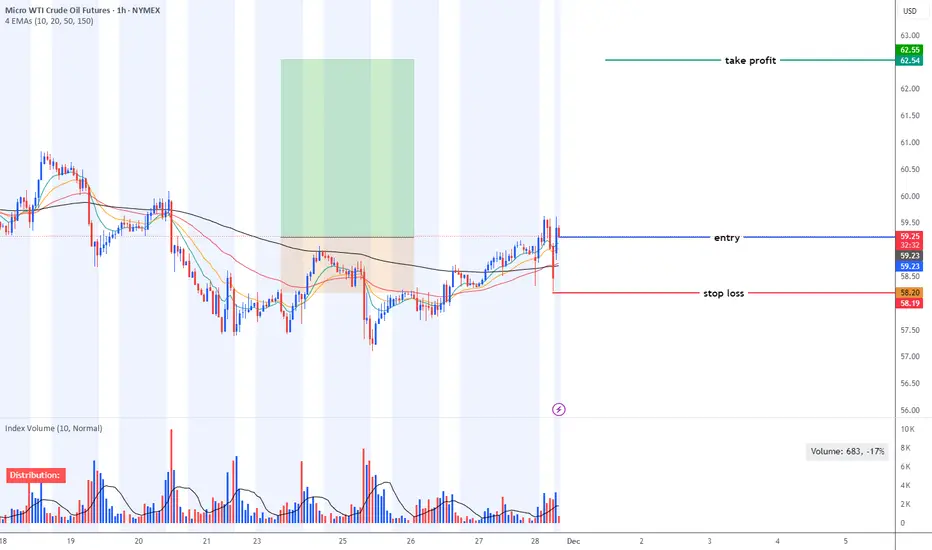
MCL - swing trade opportunity based on technical analysisMCL - swing trade opportunity based on technical analysis.
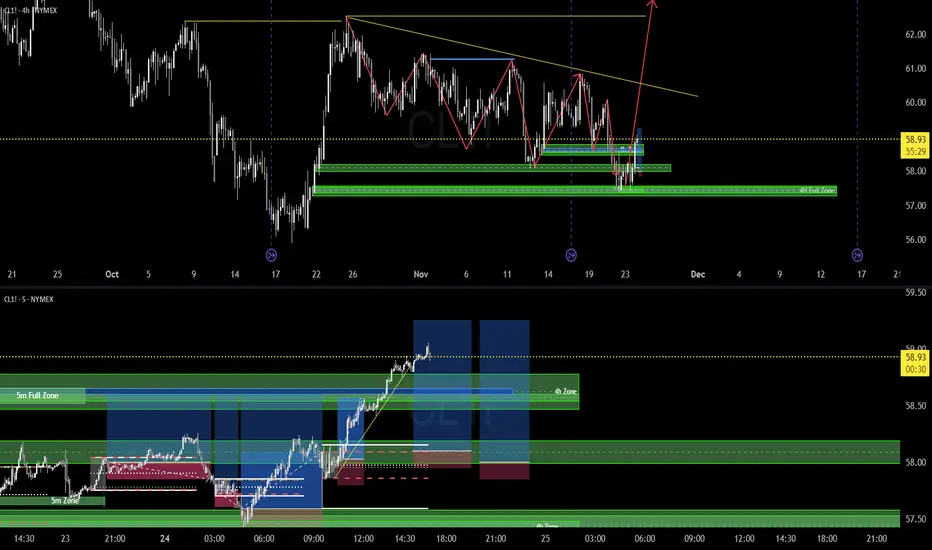
Confidence & Power | Supply & Demand Trading 4H/5m TimeframeOk, here it is for a 2nd chance.
Trendline is gonna get utterly swiped before we make a new high.
Based on 4H zones, I enter on the 5 minute chart.
- Mr. Trader-CL
See all ideas
A representation of what an asset is worth today and what the market thinks it will be worth in the future.
Sorry, this is only available to registered users
MCX provides data to our registered users only, so to get it you'll need to sign up for a TradingView account.
Displays a symbol's price movements over previous years to identify recurring trends.