Trade ideas

A review of the markets on November 10th Here is a review of the markets. Great reversal patterns to go long or short that have happened over the last couple of days take a look and chart these out for yourselves and you'll be surprised by how much money you can make.

Silver buySilver looks strong right now. Every time it dips, buyers step in fast. The trend has been up for a while, and it keeps making higher lows. Gold staying firm helps too, and a weaker dollar usually gives silver extra push.

SI - hourly chartT.A explained -
BackSide (BS)
FrontSide (FS)
Inverse BS (Inv.BS)
Inverse FS (Inv.FS)
BS & FS levels are expected support when dashed lines, tested when dotted and resistance when solid lines.
The inverse is true for the Inv. BS Inv. FS levels, they are resistance as dashed lines, tested as dotted and support as solid lines.
Monthly timeframe is color pink
weekly grey
daily is red
4hr is orange
1hr is yellow
15min is blue
5min is green if they are shown.
strength favors the higher timeframe.
2x dotted levels are origin levels where trends have or will originate. When trends break, price will target the origin of the trend. its math, when the trend breaks, the vertex breaks too so the higher timeframe level/trend that breaks, the more volatility there could be as strength in the orders flow in to fuel the move.

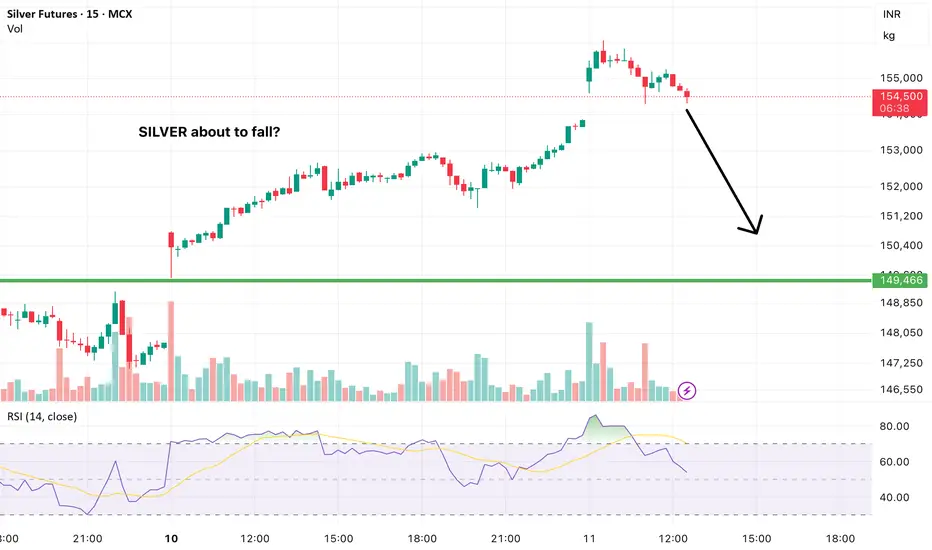
SILVER forming dangerous chart pattern today. Can fall from hereSilver forming negative or weka pattern on 15 minute charts which is indicating pressure from higher levels.
Can fall from here as per this chart pattern
Share this with your friends who trade in Commodities.
This is not an investment advice.
SI1! - Silver Futures - 4 hour
Inverse H&S Highlighted. Double top (note the median line & price action rules). Inside retest of an upper parallel (not shown however the median line is and is highlighting support at confluence (one shown)). Multiple pullback trade variants currently a 2 lower low and inside day variant. Will it trigger?
SI1! ATH $58.360

$SI_F next target 80#silver is ready for the next leg or wave up to 80 in my opinion. We consolidated and once the high is broken shorts will squeeze it upto to 80, then 80% chance of move to 100
AMEX:SLV NYSE:AG AMEX:AGQ NYSE:PAAS AMEX:PSLV NYSE:WPM and more can easily bring in some great gains of 60%
Get stacking and ready for some great returns in metals.

Continue OF Silver longThis is the updated chart of SILVER long that i posted 3 days back.
Same conditions still intact. A breakout from this pattern can push silver to 156000 Levels.
Keep a check on the chart and the pattern on 4 hour Timeframe of MCX SILVER.
Disclaimer- This is just for educational purpose.
Jai Shree Ram.

Long on Silver FuturesThis is an update on the long-term bull trend in silver as reflected in the futures market. First, the uptrend channel was reentered after a short breakout. This correction is good. It is strong as the heart line has not been broken and is seeking higher levels to break back out of the channel for the parabolic run. I am looking at a 49.80 USD marker to signal a true run back into price discovery.

Technical Analysis Silver Breakdown November 2025Follow @GoldenZoneFX for more analysis and uptades on multi- instruments

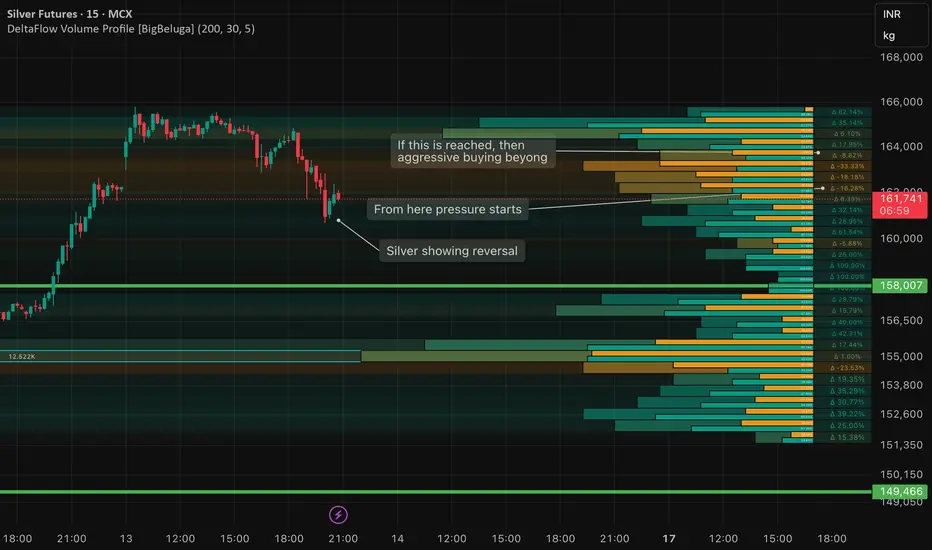
SILVER showing reversal from lower levels as US Govt reopensSilver crashes and wipes away entire day's gain by falling around 3000 points on MCX and is now showing a reversal on 15 min chart as investors turned to precious metals as a hedge against rising global uncertainties. Hopes of upcoming Federal Reserve rate cuts—driven by signs of a softening US job market—also boosted sentiment. Supply-side worries added further support, with India’s wedding season increasing demand and concerns emerging over possible US tariffs on silver. Additionally, the US Department of the Interior recently classified silver, copper, and metallurgical coal as “critical minerals,” underscoring their strategic economic importance. This new status could pave the way for Section 232 investigations and potential trade restrictions, similar to the actions taken on copper earlier this year.
Future Nearing.Been peeped Silver since 2023, watch as price rally above $42 soon. Especially with Gold topping out above $3K. The future, full of robotics and humanoids, is nearing. Who’s ready? Who’s scared? Who’s taking advantage of this opportunity?
Whatever happens, do not fomo, stay calculated.

SI1! - 4 hour Silver Futures
Embedded inverse head and shoulder patterns making up the right shoulder of a larger head and shoulder pattern. Breakout to resistance at a midpoint of prior structure.
2.1041/1 Buyers.

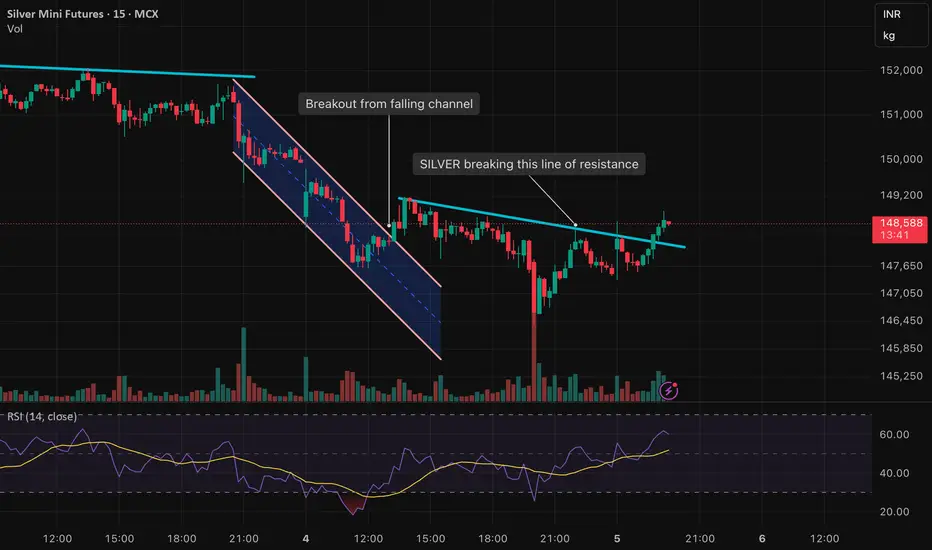
SILVER breaks above Line of ResistanceSILVER price breaks the marked line of resistance. Earlier the chart was respecting this line however this time it broke after US Employment data which is supportive for gold and silvre prices
SILVER forming a wedge pattern ready for either side brakoutPrice action on Silver is getting tighter and is now trading inside a wedge formation, which usually leads to a strong move once price breaks out — either up or down. No bias yet, just preparing for momentum on whichever side gives confirmation.
📌 What I’m watching:
• Trendline breakout with volume
• Retest + continuation for safer entries
• Volatility spike around key levels
• RSI & momentum alignment before execution
⚠️ Not a buy/sell call. This is just market observation for educational purposes.
Trade your own plan, manage risk, and respect position sizing.
If you like clean chart breakdowns, price-action setups and real-time market tracking — hit follow so you don’t miss the next update.
Silver MCX Future - Intraday Technical Analysis - 5 Nov., 25MCX:SILVER1!
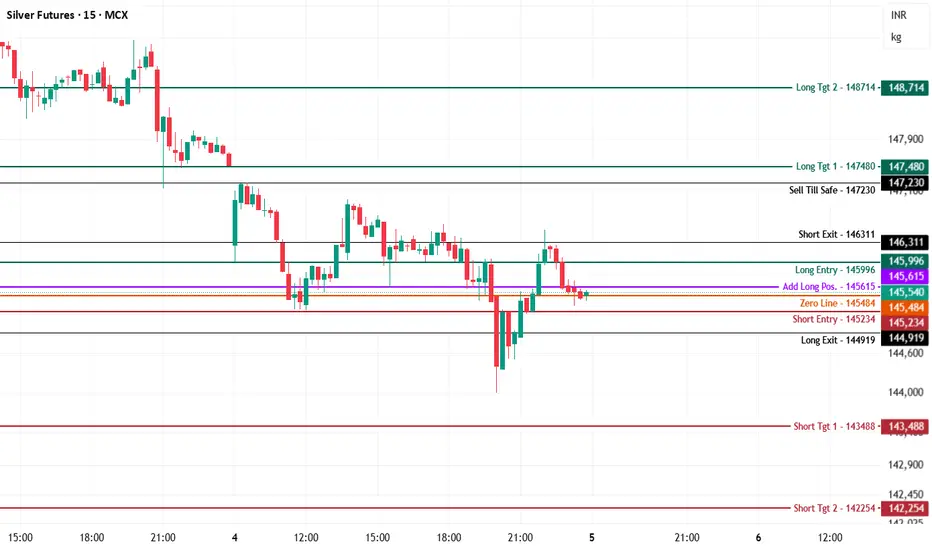
MCX Silver Futures — Chart Pathik Insights | 5-Nov-25
Silver is consolidating near 145,540, crossing above and below the zero line (145,484) in a tight, range-bound session. The market's response to each test of the long entry (145,996) and add-long (145,615) suggests indecision and whipsaw potential, typical after recent selling pressure.
Bearish Structure:
Short bias is maintained below 145,234, especially if repeated failures at the add-long zone develop into renewed downside strength.
Downside Levels:
143,488: Fast target for partial shorts or defensive trades.
142,254: Full extension if sellers reclaim momentum through the session.
Risk Management: Shorts should be covered above add-long/zero line zones, or trailed aggressively if volatility subsides.
Bullish Structure:
Longs initiate convincingly above 145,996, with further strength evident above short-exit (146,311).
Upside Levels:
147,480: Nearest breakout target for momentum bulls.
148,714: Ambitious extension if market regains trending character.
Risk Management: Longs should use stops near the add-long region (145,615) or tighten if price fails to hold above 145,996 after breakout attempts.
Neutral/Range Logic:
With 145,484 at the core, choppy action should persist until a directional thrust. Look for confirmation before increasing size.
Use these pivots for rational trades, tactical exits, and position sizing.
If Chart Pathik’s mapping aligns with your session, boost, comment, and share—every engagement builds a sharper trading community.
Follow for adaptive analytics, mapped structure, and focused learning, every trading day.
SI1! - Comex Silver Futures 4hr
Head and shoulder pattern noting the conflicting inverse H&S in it’s right shoulder.
Break out or Break down?
Bias 3.7458/1 Sellers

02.11 - Silver UP Setup based on H4 order flow. Buy orders has been collected so is possible to price go higher to sell silver for better price. Now is time to wait for price sweep liquidity and give lower time confirmation to buy (m5 order flow). Simple as that.

MCX-SILVER 1HR SWING Mahi Tamil: ⚪ Chart Overview
• Timeframe: 1 hour (each candle = 1 hour)
• Instrument: MCX Silver Futures
• Analysis Type: Elliott Wave + Head & Shoulders + Demand Zone
⸻
🧩 1. Main Pattern — “Inverse Head and Shoulders”
This chart clearly shows an Inverse Head and Shoulders formation — a bullish reversal pattern that forms after a downtrend.
Structure:
• Left Shoulder: Small dip and recovery (first low)
• Head: Deepest low (main bottom — marked as “5”)
• Right Shoulder: Higher low forming above the head (final dip)
This pattern indicates buyers are coming back and preparing for an uptrend.
⸻
🟢 2. Demand Zone
At the bottom, a Demand Zone is marked — that’s the strong support area (where buying pressure is high).
When price comes back to this zone (around where the right shoulder ends), buyers are expected to push the price up strongly.
⸻
🔵 3. Elliott Wave Count
You can see smaller wave counts (1–5) drawn inside both the down move and the current rising structure.
• The first 1–5 downtrend shows completion of an impulsive fall.
• After that, the current rising channel looks like a corrective wave (A).
Then:
• Price is expected to drop slightly to form wave (B) (back into demand zone).
• After that, a big wave (C) rally is expected — marking the upside breakout.
Mahi Tamil: 📈 5. Expected Movement (Summary)
1. Silver is forming an inverse head & shoulders bottom.
2. Currently completing right shoulder formation.
3. Price may dip slightly into the Demand Zone (to form wave B).
4. Then, a strong upward move (wave C) is expected — possibly a bullish breakout.
⸻
🧭 6. Simplified Forecast Path
👉 Current: Slight drop toward ₹145,000–₹146,000 (Demand Zone)
👉 Then: Reversal and rally to ₹150,000+ (Wave C target)
⸻
💡 In Short:
• Pattern: Inverse Head & Shoulders → Bullish reversal
• Support (Buy area): Demand Zone (right shoulder)
• Next Move: Small fall → Strong rally
• Confirmation: Break above “CHOCH” level confirms the uptrend

Emphasis on goldThis is Saturday night. Warren Buffett's very bearish on gold but a better way to look at it in my opinion is that the pattern is going to actually take the market lower than where it is now probably around the 50% but I think it's going to go to the 618 and possibly lower///and that doesn't mean that the market's bearish it's better to think of this as the market trading the patterns it had a wonderful move higher and so you would expect the market to have a very good move when it goes lower and you can use this with your trading decisions////if the market goes lower it's an opportunity to take a long trade if you have a good setup with a good 2 bar reversal going higher.

SI = week 44I added some 1hr levels and then pulled the untested levels over.
See the last SI chart for the difference (on chart)

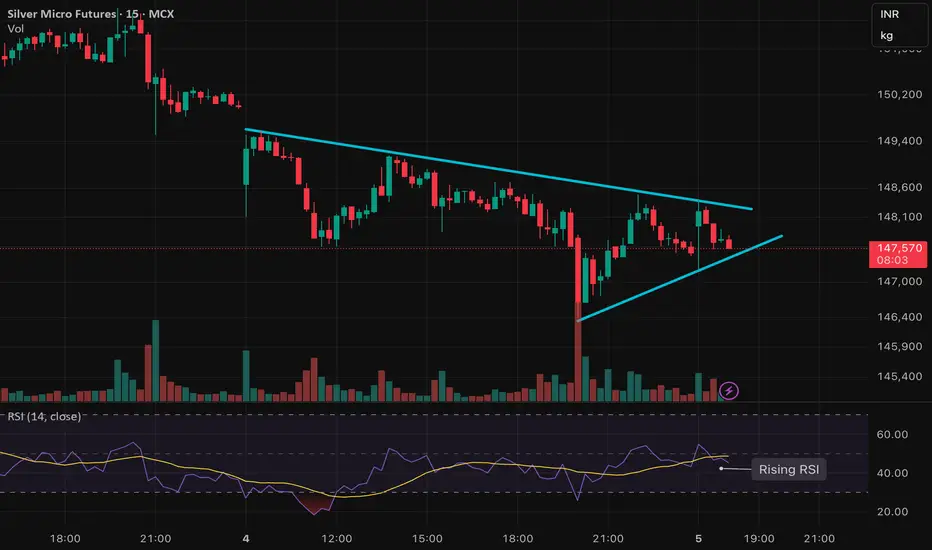
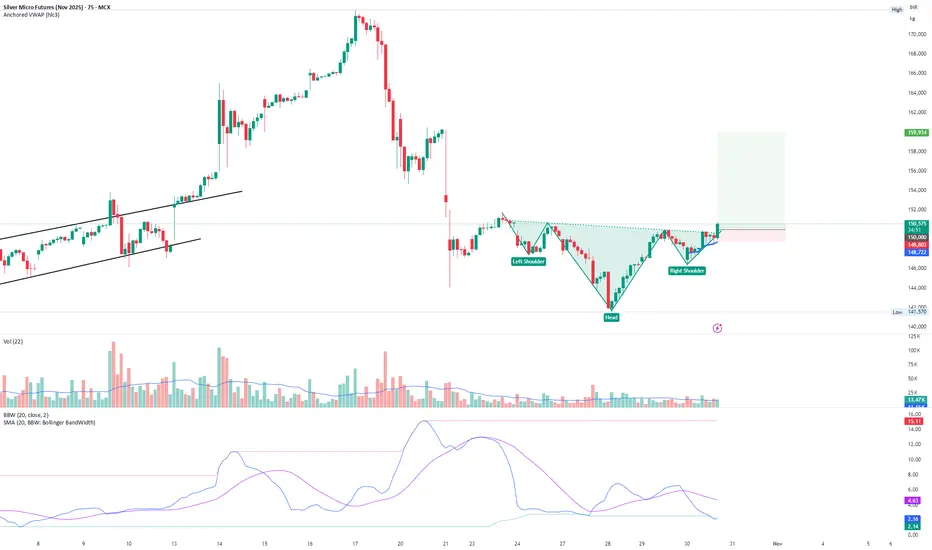
Silver micro breakout tradeInverse head and shoulders breakout is in progress in silver micro futures.
Silver tried to go down thrice but failed and came back up.
The bearish candles were strong as well but still silver stood ground and is breaking out.
Currently silver has formed inverse head and shoulders pattern.
1st Possible target can be 159900 rs which is 21st october high.
COMEX Silver Futures : Head & Shoulder chart pattern formationCOMEX Silver futures is forming Head & Shoulder chart pattern with a neckline at 45.90. A break below this support level could lead to further correction. Currently, the price is 47.75, facing resistance at 48.5-49.
Key Levels:
- Neckline Support: 45.90
- Current Price: 47.75
- Resistance: 48.5-49
- Potential Outcome: Break below 45.90 may lead to further decline, while sustaining above 49 could indicate a bullish reversal
Trading Strategy:
- Break Below Neckline: Potential short-term correction
- Resistance Breakout: Sustaining above 49 may lead to upside momentum
- Risk Management: Monitor price action around key levels for trading opportunities
