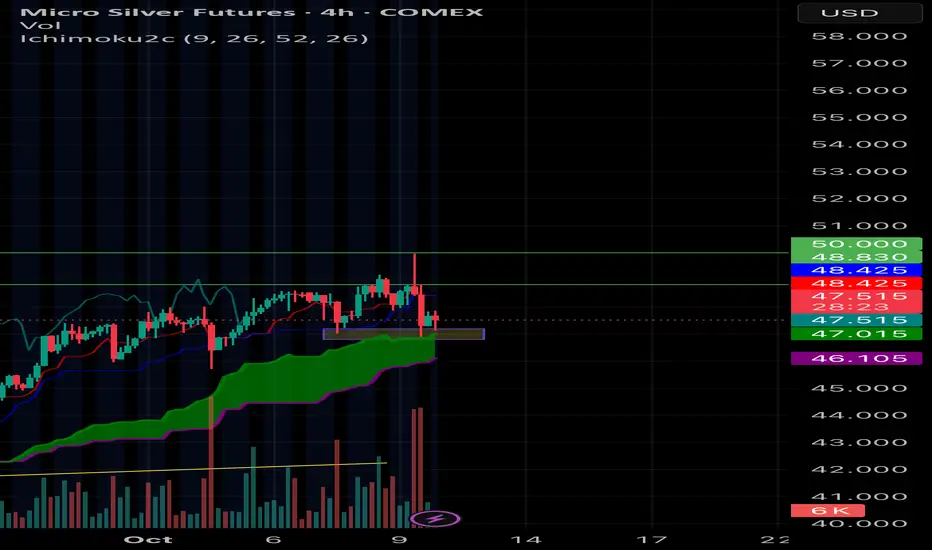
SILVER: Bullish, But Retracing. Sell The Dip, Buy At the +FVG!SIlver, like the other metals, is bullish. Currently, price is retracement. This could present a selling opportunity.
The -FVG is holding price at bay, If the market continues to respect this premium array, look for short term sells down to the sellside liquidity at the relative equal lows at 46.70, in
route to the Weekly +FVG.
There, we will look for high probability buy setups.
This is an ERL to IRL move, my peoples.
*Price may sweep the consolidation high before dropping lower. So be mindful of the potential for a liquidity event before the move.
Enjoy!
May profits be upon you.
Leave any questions or comments in the comment section.
I appreciate any feedback from my viewers!
Like and/or subscribe if you want more accurate analysis.
Thank you so much!
Disclaimer:
I do not provide personal investment advice and I am not a qualified licensed investment advisor.
All information found here, including any ideas, opinions, views, predictions, forecasts, commentaries, suggestions, expressed or implied herein, are for informational, entertainment or educational purposes only and should not be construed as personal investment advice. While the information provided is believed to be accurate, it may include errors or inaccuracies.
I will not and cannot be held liable for any actions you take as a result of anything you read here.
Conduct your own due diligence, or consult a licensed financial advisor or broker before making any and all investment decisions. Any investments, trades, speculations, or decisions made on the basis of any information found on this channel, expressed or implied herein, are committed at your own risk, financial or otherwise.
Silver Mini Futures
Trade ideas

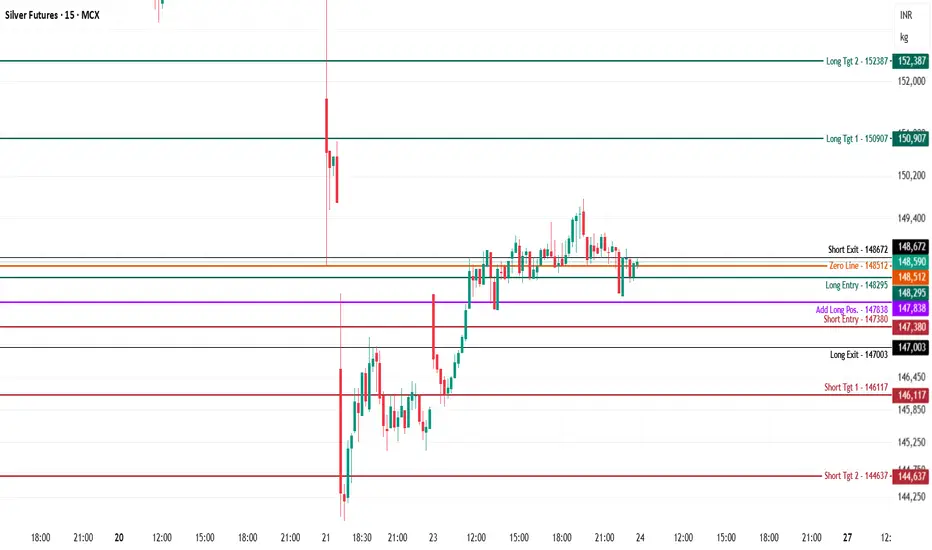
Silver MCX Future - Intraday Analysis - 24 Oct., 2025 $MCX:SILVER — Chart Pathik Insights | 24-Oct-25
Silver is locked in a tight consolidation near 148,590, magnetized by the zero line at 148,512 amidst swings between failed breakouts and quick retests. The session’s setups provide clearly defined boundaries for disciplined intraday positioning.
Bearish Strategy:
Short entries are viable below 147,380, especially if repeated recoveries stall at the add-long zone (147,838) or get sold into near session lows.
Downside Levels:
146,117: First profit target or cover for scalp shorts.
144,637: Deeper reach for extended selling action.
Risk Management: Secure shorts with stops above 147,838, or tighten control if sharp bullish reversals develop.
Bullish Strategy:
Long signals activate above 148,295, with upward momentum confirmed if buyers conquer 148,672 and close above.
Upside Levels:
150,907: The day’s major upside marker for profit-taking or scaling out.
152,387: High extension for trending strength.
Risk Management: Manage long trades using 147,838 or 147,380 stops suited to trade entry and pace.
Neutral Zone:
148,512 functions as today’s inflection band. Chop is probable while the price hovers here—wait for a real push before committing capital to a directional move.
Rely on these levels for structured entries, timed exits, and quick adaptation.
If these levels sharpen your edge, boost, comment, and share—your encouragement grows this learning community.
Follow Chart Pathik for focused zones, rational strategy, and authentic, real-time trading knowledge.
Gold vs SilverGold approaching Oct 14 mitigation zone while Silver approaches Oct 10 mitigation zone.
Gold price action more bearish over london session but in higher timeframe, gold dropping less aggressively considering it's barely approaching Oct 14 price while Silver already well below its respective Oct 14 levels.
Will be a market execution idea based on which gets to its zone last.

SI - Week 43BS & FS levels are expected support when dashed lines, tested when dotted and resistance when solid lines.
The inverse is true for the Inv. BS Inv. FS levels, they are resistance as dashed lines, tested as dotted and support as solid lines.
Monthly timeframe is color pink
weekly grey
daily is red
4hr is orange
1hr is yellow
15min is blue
5min is green if they are shown.
strength favors the higher timeframe.
2x dotted levels are origin levels where trends have or will originate. When trends break, price will target the origin of the trend. its math, when the trend breaks, the vertex breaks too so the higher timeframe level/trend that breaks, the more volatility there could be as strength in the orders flow in to fuel the move.

SilverSilver traded down to its previous high and that should be 50 and I believe I mis stated it as 30. This was a reasonable retest from Friday's high but there is a possibility that the market could expand lower to an ABCD pattern giving a much better return if you shorted the market. Markets commonly retest the previous high when there's a breakout higher. If the market actually goes lower to the ABCD pattern I would consider that an opportunity to go long depending on how it looks at that time. if you get a chance listen to Warren Buffett's point of view regarding gold

/SI: Going ShortEvery time weekly RSI > 86,
1. 60% of the time it go down after 1 week
2. 80% of the time it go down after 2 weeks
3. 100% of the time it go down after 3 weeks
4. 100% of the time it go down after 1 month
4. 100% of the time it go down after 2 months
4. 100% of the time it go down after 3 months
4. 100% of the time it go down after 6 months

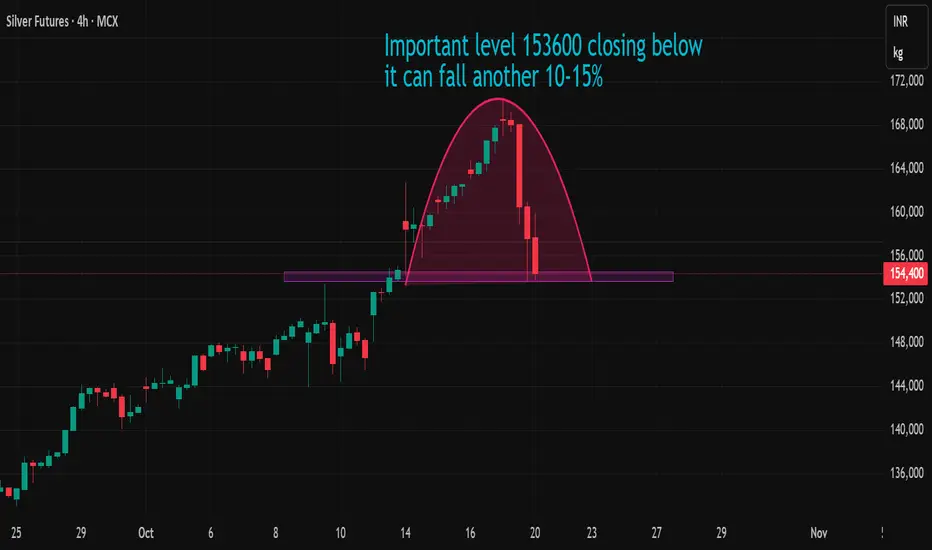
Silver at Important LevelSilver at important level at 153700 if start below closing of 153700 then can see a fall of another 10%
Comex Silver Futures : End of Bull Run OR Big One ComingLooking at the long-term chart since the 1972 low, the price structure appears to be forming a rising wedge pattern. After testing the $41 high in 1980, prices entered a consolidation phase, continuing to form higher highs and higher lows. The chart also displays a Cup and Handle formation, indicating a potential bullish breakout setup.
Currently, prices are trading near a strong resistance zone between $53.50 and $55 on a weekly closing basis. A decisive breakout and sustained move above $55 could propel prices into a new trading territory, with potential upside targets between $90 and $140.
However, if prices fail to hold above the $55 resistance, a deep correction could follow. In such a scenario, prices may decline by around 40% toward the $30 level where buying is advise. In a worst-case correction, could even drop toward $20.

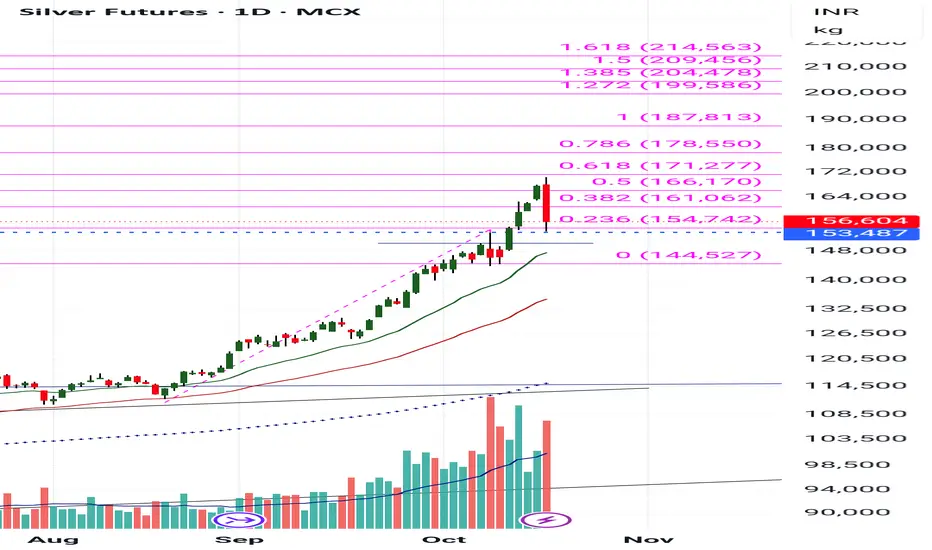
Silver 6% FallSilver corrected by 6% yesterday after a beautiful recent rally.
It touched 23.6% of Fibonacci. Expecting some consolidation now for say 2-3 days before hopefully bouncing back.
Let's see the opening of Monday !!!
Silver Market Update Easy Breakdown!Silver’s been showing some strong moves lately ⚡ but it’s at a key decision point right now.
Here’s what I’m watching:
📉 If silver drops below 51.2, we could see a pullback toward 49.30–49.00 before the next push higher.
📈 For silver to reach the next big highs around $70, it needs to break above 52.60 first.
If that happens, the next targets are 54.60 and 57.00.
💡 So short-term dips? Totally normal.
Long-term silver still looks strong if it can clear those resistance levels.
Want to see how I’m reading these moves and what I’m watching next before it happens?
💬 DM me “SILVER” and I’ll share my private breakdown and targets directly.
Mindbloome Exchange
Trade Smarter Live Better

silver This is an example of a silver trade it started with a 2 bar reversal and move lower by around 3 points this is a test video

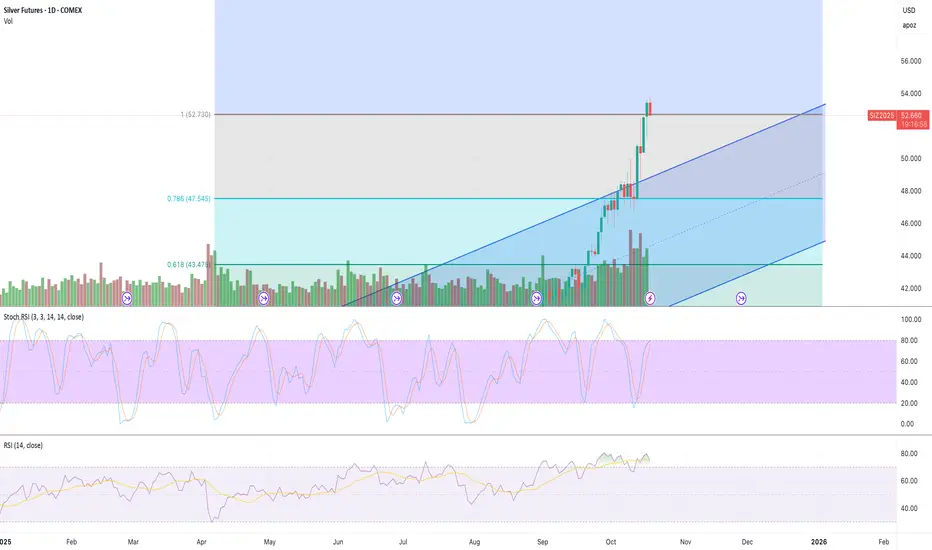
SLV1 Futures updateSLV1 Futures have broken the uptrend clearly and are holding. I added Fib extensions, as you can see. Next target is 67.71. We are currently hovering at support of 52.73 on the daily. This is a bull market in metals in general. Here are some good ideas. If silver breaks back into the channel, we would be back in a bear/sideways market that silver knows too well.
Silver MCX Future - Intraday Technical Analysis - 15th Oct., 25 $MCX:SILVER — Chart Pathik Insights
Nightly Silver levels are shared to keep your trades structured, actionable, and risk-calibrated in all market conditions.
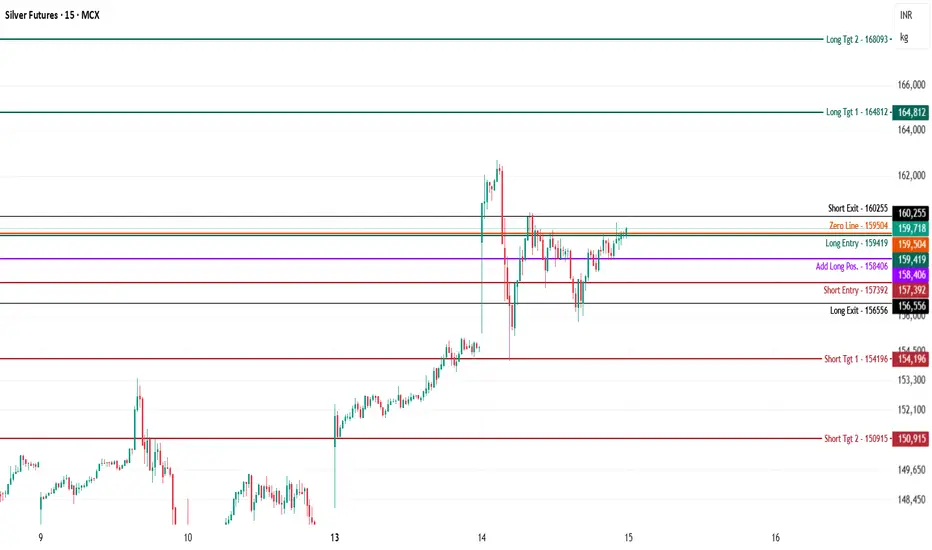
Silver is trading at 159,718, testing just above the zero line (159,504) after a volatile session that saw deep dips and strong recoveries into resistance.
Bearish Outlook
Short sellers remain favored below 157,392, particularly if momentum wanes at key inflection or resistance zones.
Downside Levels to Watch:
154,196: First target for short partials or quick booking.
150,915: Large-range extension if the downward leg develops fully.
Risk Control: Maintain shorts under 156,556; reverse or stand aside on closes above 158,406.
Bullish Outlook
Fresh long ideas activate above 159,419, with confidence growing on closes above 159,718 and confirmation through 160,255.
Upside Levels to Watch:
164,812: The foremost mapped resistance for profits.
168,093: Ambitious extension if bulls dominate.
Risk Control: New longs can be managed near 158,406 or 157,392, suited to pace and risk preference.
Neutral Range Logic
The neutral band at 159,504 will trigger sideways action if unresolved. Wait for persistent moves above or below this band before committing, as range trades can whipsaw in these conditions.
For traders aiming for discipline and structure, these levels guide each session’s approach.
If these levels bring clarity to your trading day, boost, comment, and share — your response powers the regular flow of insights.
Follow Chart Pathik for proven level-mapping, practical analysis, and daily learning.
SI1! - Dancing on the SILVER Tracks🔱 I like risk. Specially when it's skewed to my favor 🔱
WL1 has been reached, and the market is wildly overextended.
Is it crazy to stand in front of this speeding train?
Absolutely — if you don’t know when to jump.
I’ve done my warm-up, and I’m ready to leap off the rails the moment it gets too close, too fast.
My move is with options — that means my risk is defined, my escape route mapped.
I would never short the underlying — not in a million years.
Now let’s see if this setup earns me that Steak & Lobster target.

Silver...I'm not quite sure when the precious metal bubble will end, since gold keeps setting new highs, maybe silver will give us a better indication. I assume it'll at least go to the purple line, possibly test a new high?
It's like the 80's again, oh boy! I love the 80's.

Silver MCX Future - Intraday Technical Analysis - 14th Oct., 25$MCX:SILVER — Chart Pathik Insights
Nightly levels for Silver Futures are provided to give traders a clean, structured approach to decoding market behavior. These setups are focused on actionable, logical planning with risk managed at every step.
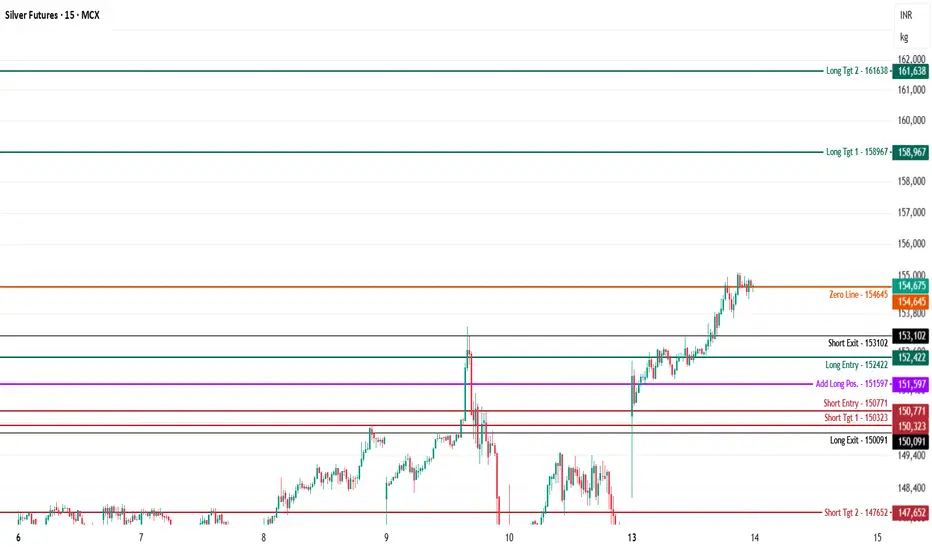
Silver is currently trading near 154,675, consolidating just above the zero line (154,645) after a strong impulsive move from the recent lows.
Bearish Outlook
Short bias remains valid below 150,771, especially if price slips under intermediate pivots and momentum weakens.
Downside Levels to Watch:
150,323: First short target for partial covering.
147,652: Major extension if selling gathers pace.
Risk Control: Shorts remain actionable below 150,091. If price reverses and sustains above 151,597, it's time to cover or reassess.
Bullish Outlook
Fresh long opportunities may emerge above 152,422, with conviction building as price sustains over 153,102 and targets higher zones.
Upside Levels to Watch:
158,967: Key mapped resistance and first profit area.
161,638: Extension if upside momentum continues.
Risk Control: Long trades are best protected near 151,597 or 150,771, based on risk tolerance and structure.
Neutral Range Logic
The 154,645 zero line is the immediate chop band. Persistent oscillation here calls for patience — await a conviction break to establish next direction. Use boundary zones for scalps or stand aside until a clear trend emerges.
📊 For traders valuing structure and discipline, these levels arrive daily.
If these setups help shape your plan, boost, comment, and share — every bit of engagement continues to fuel this work.
Follow Chart Pathik for daily precision, open learning, and genuine community spirit — because trading progress thrives on collective insight.
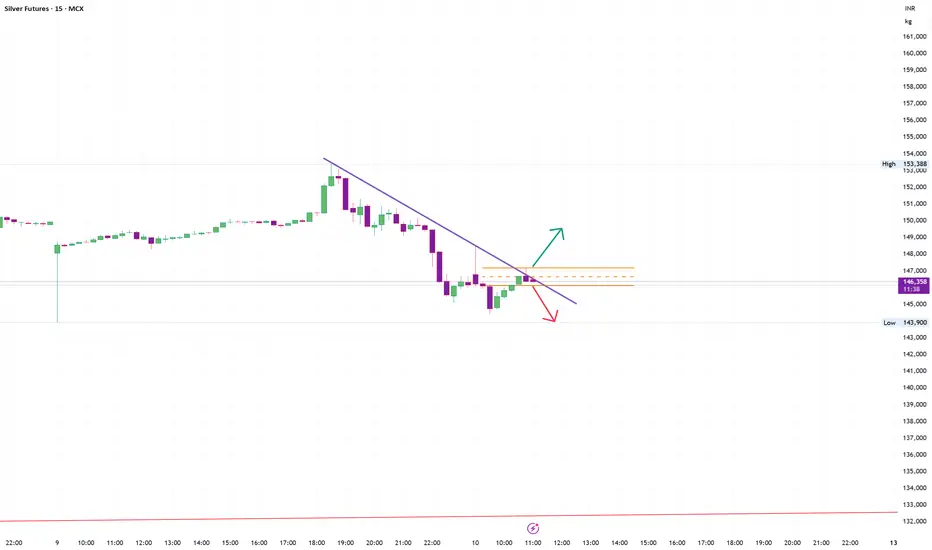
Silver futures probable price projection1. if gets rejected from the trendline may push the price lower
2. if breaks the trendline may push the price upside
Silver Buy above 148000 closing base tgt 150000Silver Buy above 148000 closing base tgt 150000,
if silver close above 148000 then buy silver for tgt 150000 positional, please keep maintain stoploss,

Silver 4 hour The SLV ETF is in an uptrend channel above the heartline. Bullish inside bar awaiting next four-hour bar for confirmation.
Expecting price discovery soon as silver futures have wicked just below 48.00USD.
I have over 100 Call options into next year at $ 43.00 for February 2026. I am invested.
Not financial advice, just my thoughts on the tech analysis.

Trend Analysis on Silver FuturesCurrently added to my 43.00 USD call position Feb 2026 by opening up 50 calls at 60.00 USD April 2026.
Currently, the 4-hour is closing above the parallel band, trying to break upward. Long-term, this will be achieved considering the macro as ATHs have been touched, and we have closed multiple times within this range during accumulation.
Looking to exercise some of these calls at a later date. Probably trade the premium as well.
I am invested, and this is not financial advice.
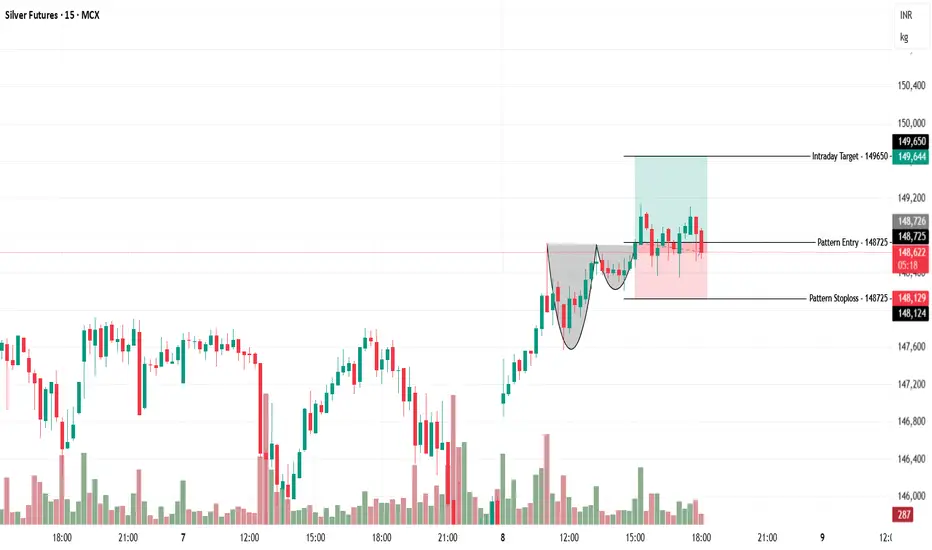
Silver Futures MCX – Chart Pattern Analysis - IntradayMCX:SILVER1!
A classic “Cup and Handle” breakout pattern is seen on Silver’s 5-min chart, with a bullish entry confirmed above 148,725 and an intraday target at 149,650.
Pattern Logic
Cup and Handle Formation:
Price created a rounded base (cup) followed by a minor pullback (handle), consolidating near the recent resistance before the breakout.
The breakout occurs at 148,725 with strong momentum and higher volume, confirming bullish sentiment.
Trade Structure
Entry:
Long entry above 148,725 at pattern breakout zone.
Stop Loss (SL):
Placed at 148,129, below handle and support—limits risk if pattern fails.
Intraday Target:
149,650 is the logical measured move, derived from cup depth and prior resistance zone, marking an ideal area for profit booking.
Trade Psychology & Risk
Bullish Implication:
The pattern signals exhaustion of sellers and control shifting to aggressive buyers, supporting continued upside.
Risk Management:
Optimal R:R with defined SL and target, preventing overexposure if volatility returns or breakout fails.
This setup gives a disciplined, actionable intraday plan using the classic pattern, clear SL, and logical target for Silver MCX Futures.This is a clear intraday "Cup and Handle" breakout setup for Silver Futures (MCX) on the 5-minute chart. The price broke above the pattern resistance at 148,725, confirming bullish momentum and a potential move toward the intraday target at 149,650.
Key Pattern Levels and Logic
Pattern Entry: 148,725 – Buy triggered above cup handle resistance.
Pattern Stoploss: 148,129 – Placed just below the handle’s low to protect against false breakouts.
Intraday Target: 149,650 – Set below the next visible resistance and aligns with the pattern’s measured move.
Trade Plan and Psychology
The "Cup and Handle" shows sellers exhausted and buyers taking control, aiming for a momentum breakout.
The stoploss provides protection if price fails to sustain above entry, while the target delivers an ideal risk-reward.
Volume and momentum validate the breakout, supporting disciplined long entries and timely profit booking.
This technical setup gives a precise, risk-managed intraday plan for Silver Futures MCX, leveraging pattern structure and key levels to trade with conviction.
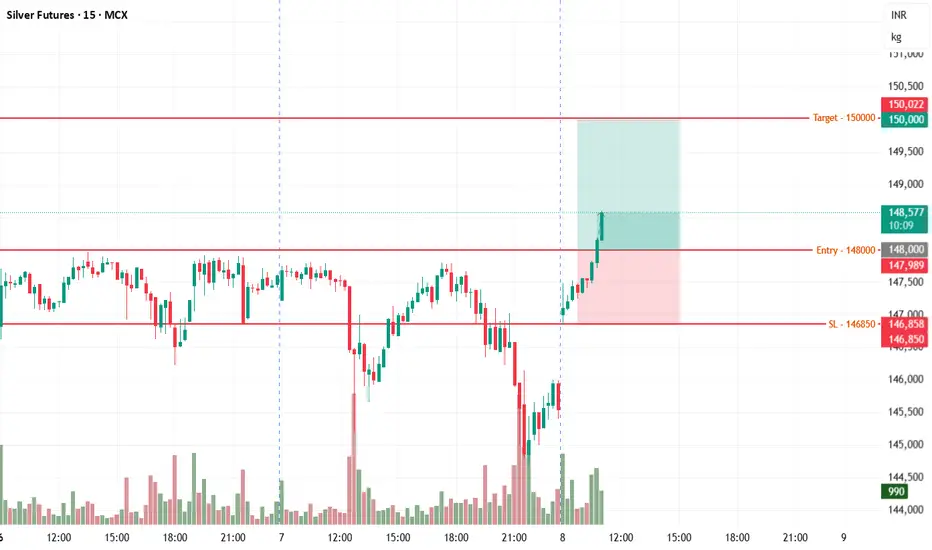
MCX Silver Futures – 15min Trade AnalysisMCX:SILVER1!
A fresh bullish momentum trade is identified, with price currently at 148,220 and the breakout entry having just triggered at 148,000.
Trade Structure
Entry:
Buy triggered on breakout above 148,000, confirming momentum and reversal from recent swing lows.
Stop Loss (SL):
Placed at 146,850, below the local swing low and consolidation, protecting against sudden reversal.
Target:
Set at 150,000, just below prior highs and the psychological round number, providing a strong risk-reward profile.
Logic & Risk-Reward
Upside Logic:
The setup expects the sharp recovery and volume burst to sustain. Once above 148,000, bulls may drive for a new high toward 150,000.
The position offers a favorable R:R, with the zone between 146,850 and 148,000 acting as a base.
Downside/Pullback Caution:
Any quick rejection below 148,000 or increased selling could mark a false breakout, so the SL at 146,850 is essential for protection.