Sorry, this is only available to registered users
MCX provides data to our registered users only, so to get it you'll need to sign up for a TradingView account.
Related commodities

A review of the markets on November 10th Here is a review of the markets. Great reversal patterns to go long or short that have happened over the last couple of days take a look and chart these out for yourselves and you'll be surprised by how much money you can make.

Silver buySilver looks strong right now. Every time it dips, buyers step in fast. The trend has been up for a while, and it keeps making higher lows. Gold staying firm helps too, and a weaker dollar usually gives silver extra push.

SI - hourly chartT.A explained -
BackSide (BS)
FrontSide (FS)
Inverse BS (Inv.BS)
Inverse FS (Inv.FS)
BS & FS levels are expected support when dashed lines, tested when dotted and resistance when solid lines.
The inverse is true for the Inv. BS Inv. FS levels, they are resistance as dashed lines, tested as dotted

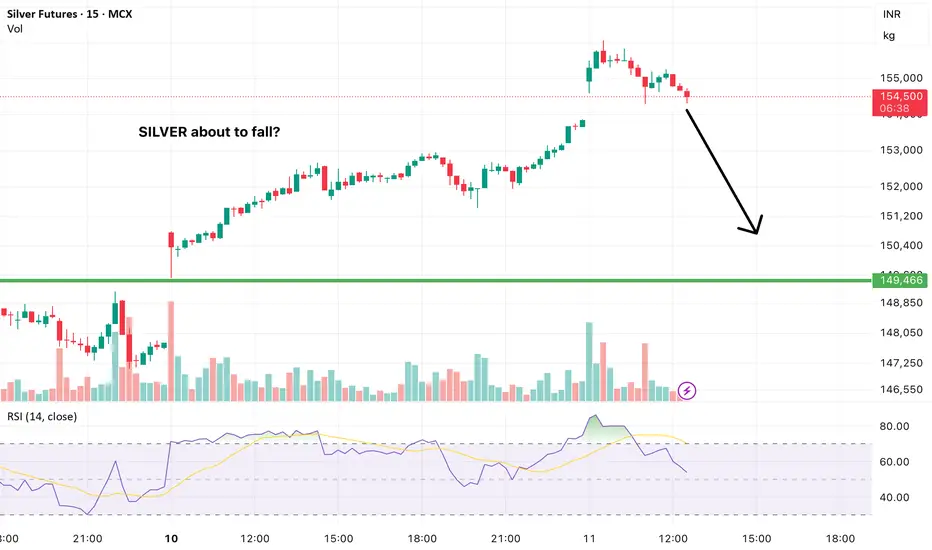
SILVER forming dangerous chart pattern today. Can fall from hereSilver forming negative or weka pattern on 15 minute charts which is indicating pressure from higher levels.
Can fall from here as per this chart pattern
Share this with your friends who trade in Commodities.
This is not an investment advice.
SI1! - Silver Futures - 4 hour
Inverse H&S Highlighted. Double top (note the median line & price action rules). Inside retest of an upper parallel (not shown however the median line is and is highlighting support at confluence (one shown)). Multiple pullback trade variants currently a 2 lower low and inside day variant. Will i

$SI_F next target 80#silver is ready for the next leg or wave up to 80 in my opinion. We consolidated and once the high is broken shorts will squeeze it upto to 80, then 80% chance of move to 100
AMEX:SLV NYSE:AG AMEX:AGQ NYSE:PAAS AMEX:PSLV NYSE:WPM and more can easily bring in some great gains of 60%
G

Continue OF Silver longThis is the updated chart of SILVER long that i posted 3 days back.
Same conditions still intact. A breakout from this pattern can push silver to 156000 Levels.
Keep a check on the chart and the pattern on 4 hour Timeframe of MCX SILVER.
Disclaimer- This is just for educational purpose.
Jai Shre

Long on Silver FuturesThis is an update on the long-term bull trend in silver as reflected in the futures market. First, the uptrend channel was reentered after a short breakout. This correction is good. It is strong as the heart line has not been broken and is seeking higher levels to break back out of the channel for t

Technical Analysis Silver Breakdown November 2025Follow @GoldenZoneFX for more analysis and uptades on multi- instruments

See all ideas
A representation of what an asset is worth today and what the market thinks it will be worth in the future.
Sorry, this is only available to registered users
MCX provides data to our registered users only, so to get it you'll need to sign up for a TradingView account.
Displays a symbol's price movements over previous years to identify recurring trends.