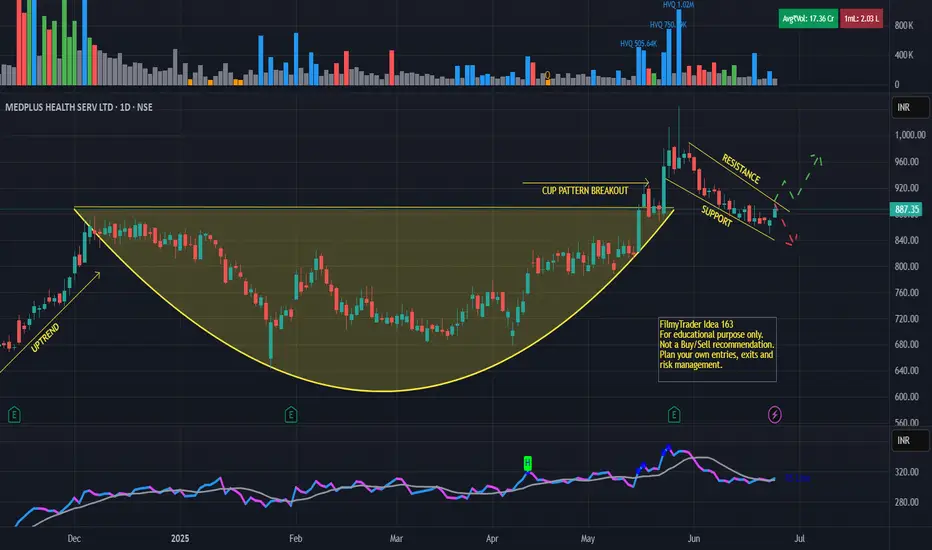
Medplus - Cup n Handle PatternMEDPLUS HEALTH SERV LTD
CUP N HANDLE pattern in daily timeframe.
Closing above previous high.
Stock outperforming benchmark and sectoral index.
PSAR indicating bullish trend.
Disclaimer:
For educational purpose only.
Please do your own research before taking any trades.
Happy Trading!
Next report date
—
Report period
—
EPS estimate
—
Revenue estimate
—
16.30 INR
1.50 B INR
61.36 B INR
51.08 M
About MedPlus Health Services Ltd.
Sector
Industry
CEO
Madhukar Reddy Gangadi
Website
Headquarters
Hyderabad
Founded
2006
ISIN
INE804L01022
FIGI
BBG013YXGVK4
IPO date
Dec 23, 2021
IPO offer price
10.46 USD
MedPlus Health Services Ltd. engages in the provision of operation of pharmacies. It operates through the following segments: Retail, Diagnostics, and Others. The Retail segment focuses on the sale of pharmaceuticals and general items. The Diagnostics segment involves the pathology and radiology services. The Others segment includes insurance broking business. Its pharmacies carry medicines, vitamins, medical devices, test kits, and fast-moving consumer goods. It also conducts pathological services and distributes medical and surgical supplies through RiteCure and its online pharmacy Medplus Mart. The company was founded by Madhukar Gangadi in 2006 and is headquartered in Hyderabad, India.
Related stocks
MEDPLUSMEDPLUS
watch above levels. green line is our entry, redline is our SL.
DISCLAIMER : I am NOT a SEBI registered advisor or a financial adviser. All the views are for educational purpose only.
MED PLUS 1WMedPlus is currently trading at ₹885 and forming a bullish triangle pattern. A healthy breakout has been observed, indicating strong momentum. With this trend, the stock appears poised to challenge its all-time high levels
Disclaimer: The information provided is for educational and informational

Descending Triangle Pattern Breakout - MedplusTechnical Analysis:
Current Price: ₹885
Stop Loss: A closing basis stop loss at ₹785 provides a defined risk level.
Target: Your target of ₹1500 suggests a significant potential upside.
Descending Triangle Breakout: A breakout from a descending triangle is typically considered a bearish sig

MEDPLUS Soars!MEDPLUS Trade Details:
This trade setup on the 15-minute timeframe demonstrated a robust bullish trend with clean signals provided by the Risological Trading Indicator , resulting in all targets being achieved.
Key Levels:
Entry: 687.90
Stop Loss (SL): 683.95
Take Profit Targets:

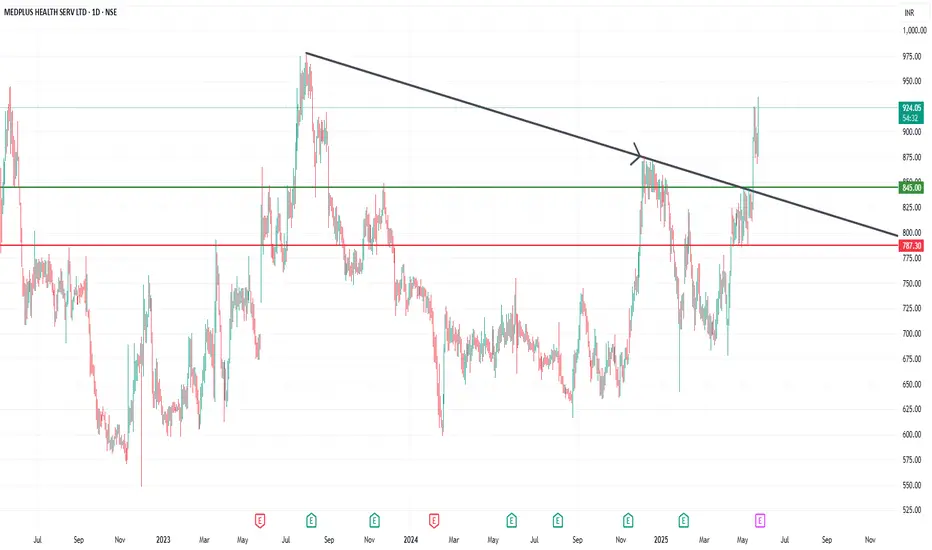
MedPlus (MEDPLUS) - Long-Term Bullish Breakout Opportunity🔍 Analysis:
MedPlus has been in a prolonged downtrend, forming a clear descending trendline. However, recent price action suggests a potential breakout, offering an exciting opportunity for long-term investors.
📊 Key Points:
1. Down Trendline Breakout: Price has recently broken above the long-term

BREAKOUT WITH HIGHER VOLUME IN MEDPLUS HEALTH...NSE:MEDPLUS trade at 720 level. Stocks give a trendline breakout with higher volume. You can watch for a big upside move at 900-1000

medplusreported a surge in first-quarter profit on Friday, driven by growth in the organised retail pharmaceutical sector.
MedPlus, which sells medicines online and in retail stores, said consolidated net profit rose 3.8 times to 143.6 million rupees ($1.7 million) for the quarter ended June 30.
Growth i

A technical trade weekly TFPrice made a double bottom pattern at important key support 615...retested twice the support area but refused to close down below .....currently the volume buildup is very strong....sl below 615 closing basis....buying zone 650-656 if comes ...Target 1is 755, Target 2 is 819, Target 3 is 960...only

Medplus accumulationMedplus can double from here with in few years. Sl below the trend line.
Chart is self explanatory. Please follow the price action & take the trade as per your appetite.
The information provided here is only for educational purpose. The information provided here is not intended to be any kind of f

See all ideas
Summarizing what the indicators are suggesting.
Neutral
SellBuy
Strong sellStrong buy
Strong sellSellNeutralBuyStrong buy
Neutral
SellBuy
Strong sellStrong buy
Strong sellSellNeutralBuyStrong buy
Neutral
SellBuy
Strong sellStrong buy
Strong sellSellNeutralBuyStrong buy
An aggregate view of professional's ratings.
Neutral
SellBuy
Strong sellStrong buy
Strong sellSellNeutralBuyStrong buy
Neutral
SellBuy
Strong sellStrong buy
Strong sellSellNeutralBuyStrong buy
Neutral
SellBuy
Strong sellStrong buy
Strong sellSellNeutralBuyStrong buy
Displays a symbol's price movements over previous years to identify recurring trends.
Frequently Asked Questions
The current price of MEDPLUS is 802.35 INR — it has increased by 4.55% in the past 24 hours. Watch MedPlus Health Services Ltd. stock price performance more closely on the chart.
Depending on the exchange, the stock ticker may vary. For instance, on NSE exchange MedPlus Health Services Ltd. stocks are traded under the ticker MEDPLUS.
MEDPLUS stock has risen by 2.87% compared to the previous week, the month change is a 5.77% rise, over the last year MedPlus Health Services Ltd. has showed a 9.07% increase.
We've gathered analysts' opinions on MedPlus Health Services Ltd. future price: according to them, MEDPLUS price has a max estimate of 1,220.00 INR and a min estimate of 970.00 INR. Watch MEDPLUS chart and read a more detailed MedPlus Health Services Ltd. stock forecast: see what analysts think of MedPlus Health Services Ltd. and suggest that you do with its stocks.
MEDPLUS reached its all-time high on Jan 20, 2022 with the price of 1,343.00 INR, and its all-time low was 548.25 INR and was reached on Dec 1, 2022. View more price dynamics on MEDPLUS chart.
See other stocks reaching their highest and lowest prices.
See other stocks reaching their highest and lowest prices.
MEDPLUS stock is 5.01% volatile and has beta coefficient of 0.92. Track MedPlus Health Services Ltd. stock price on the chart and check out the list of the most volatile stocks — is MedPlus Health Services Ltd. there?
Today MedPlus Health Services Ltd. has the market capitalization of 91.89 B, it has decreased by −0.57% over the last week.
Yes, you can track MedPlus Health Services Ltd. financials in yearly and quarterly reports right on TradingView.
MedPlus Health Services Ltd. is going to release the next earnings report on Jan 30, 2026. Keep track of upcoming events with our Earnings Calendar.
MEDPLUS net income for the last quarter is 555.01 M INR, while the quarter before that showed 423.58 M INR of net income which accounts for 31.03% change. Track more MedPlus Health Services Ltd. financial stats to get the full picture.
No, MEDPLUS doesn't pay any dividends to its shareholders. But don't worry, we've prepared a list of high-dividend stocks for you.
As of Nov 24, 2025, the company has 25.01 K employees. See our rating of the largest employees — is MedPlus Health Services Ltd. on this list?
EBITDA measures a company's operating performance, its growth signifies an improvement in the efficiency of a company. MedPlus Health Services Ltd. EBITDA is 5.48 B INR, and current EBITDA margin is 7.98%. See more stats in MedPlus Health Services Ltd. financial statements.
Like other stocks, MEDPLUS shares are traded on stock exchanges, e.g. Nasdaq, Nyse, Euronext, and the easiest way to buy them is through an online stock broker. To do this, you need to open an account and follow a broker's procedures, then start trading. You can trade MedPlus Health Services Ltd. stock right from TradingView charts — choose your broker and connect to your account.
Investing in stocks requires a comprehensive research: you should carefully study all the available data, e.g. company's financials, related news, and its technical analysis. So MedPlus Health Services Ltd. technincal analysis shows the buy rating today, and its 1 week rating is buy. Since market conditions are prone to changes, it's worth looking a bit further into the future — according to the 1 month rating MedPlus Health Services Ltd. stock shows the buy signal. See more of MedPlus Health Services Ltd. technicals for a more comprehensive analysis.
If you're still not sure, try looking for inspiration in our curated watchlists.
If you're still not sure, try looking for inspiration in our curated watchlists.