#MEME/USDT is Bullish#MEME
The price is moving in a descending channel on the 1-hour timeframe. It has reached the lower boundary and is heading towards breaking above it, with a retest of the upper boundary expected.
We have a downtrend on the RSI indicator, which has reached near the lower boundary, and an upward re
Related pairs

MEMEUSDT Forming Falling WedgeMEME/USDT is showing a highly interesting technical setup: price action is carving out a falling-wedge pattern, with tightening range lows and retracements that suggest compression and accumulation. Volume is improving, which adds credibility to the idea that smart money or traders are building posi
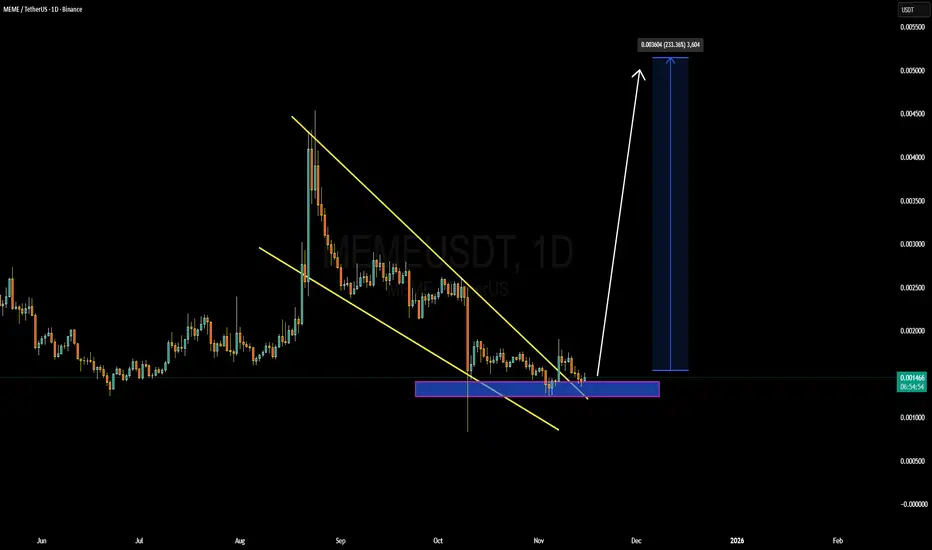
MEMEUSDT — The Bull Last Stand: Accumulation or Total Surrender?📉 Overview
MEME/USDT is standing on the edge — between a massive accumulation opportunity and complete market capitulation.
The price is now sitting right above the major support zone (0.0012 – 0.00165 USDT), a key defensive area that has been tested multiple times since April 2025.
Each visit to

Memecoin DailyView | The Web3 Power of Memeland💀 Hey , how's it going ? Come over here — Satoshi got something for you !
⏰ We’re analyzing Meme on the 1-Day timeframe .
👀 On the daily timeframe of Memecoin, we can see that after a deep 93% correction, MEME broke out of its descending channel. It then faced another pullback on lower timeframes.
Long MEMEMEME has returned to its consolidation range and is currently bouncing off the range low.
LONG setup is as in chart.
Disclaimer:
This analysis is based on my personnal views and is not a financial advice. Risk is under your control.

#MEME/USDT#MEME
The price is moving within a descending channel on the 1-hour frame and is expected to break and continue upward.
We have a trend to stabilize above the 100 moving average once again.
We have a downtrend on the RSI indicator that supports the upward break.
We have a support area at the low

#MEME/USDT#MEME
The price is moving in a descending channel on the 1-hour frame and is adhering to it well and is heading to break it strongly upwards and retest it
We have a bounce from the lower limit of the descending channel, this support is at a price of 0.00284
We have a downtrend on the RSI indicato

MEMEUSD LONGMEMEUSD crossed 200EMA on daily. It can fail, but where to? lower? Considering that BTC % is dropping to hell, alts suppose to pump, lets see the pump.


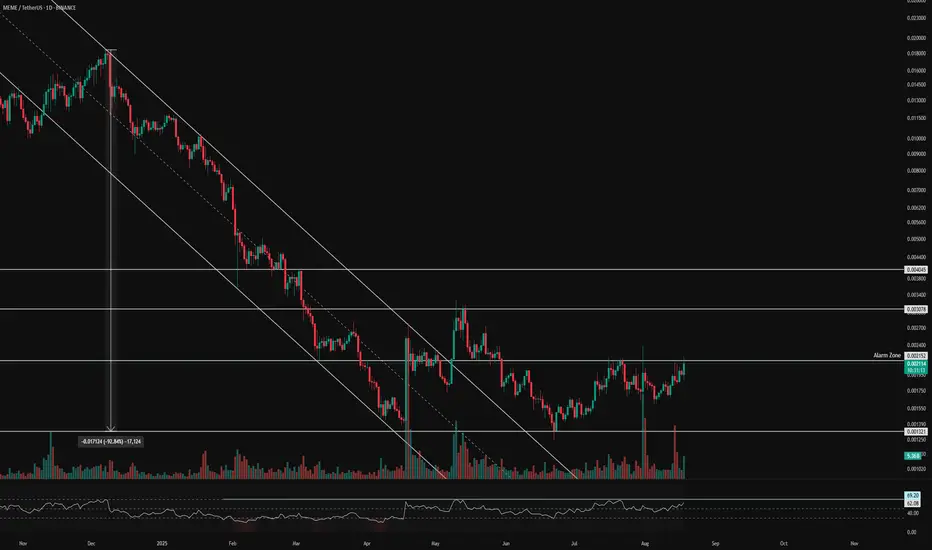
MEME Main trend -97% Channel. Reversal or scam zone.Logarithm. Time frame 3 days (less is not needed).
🟡 The price has reached a decline from the highs (not a listing squeeze) -97%. These are practically the maximums of declines after the hype for cryptocurrencies of such liquidity (96-98), after which there is only a complete scam. At the moment, t

See all ideas
Summarizing what the indicators are suggesting.
Oscillators
Neutral
SellBuy
Strong sellStrong buy
Strong sellSellNeutralBuyStrong buy
Oscillators
Neutral
SellBuy
Strong sellStrong buy
Strong sellSellNeutralBuyStrong buy
Summary
Neutral
SellBuy
Strong sellStrong buy
Strong sellSellNeutralBuyStrong buy
Summary
Neutral
SellBuy
Strong sellStrong buy
Strong sellSellNeutralBuyStrong buy
Summary
Neutral
SellBuy
Strong sellStrong buy
Strong sellSellNeutralBuyStrong buy
Moving Averages
Neutral
SellBuy
Strong sellStrong buy
Strong sellSellNeutralBuyStrong buy
Moving Averages
Neutral
SellBuy
Strong sellStrong buy
Strong sellSellNeutralBuyStrong buy
Displays a symbol's price movements over previous years to identify recurring trends.
Frequently Asked Questions
The current price of MEME / TetherUS (MEME) is 0.000944 USDT — it has fallen −0.32% in the past 24 hours. Try placing this info into the context by checking out what coins are also gaining and losing at the moment and seeing MEME price chart.
MEME / TetherUS price has fallen by −7.81% over the last week, its month performance shows a −26.37% decrease, and as for the last year, MEME / TetherUS has decreased by −91.30%. See more dynamics on MEME price chart.
Keep track of coins' changes with our Crypto Coins Heatmap.
Keep track of coins' changes with our Crypto Coins Heatmap.
MEME / TetherUS (MEME) reached its highest price on Nov 3, 2023 — it amounted to 0.100000 USDT. Find more insights on the MEME price chart.
See the list of crypto gainers and choose what best fits your strategy.
See the list of crypto gainers and choose what best fits your strategy.
MEME / TetherUS (MEME) reached the lowest price of 0.000836 USDT on Oct 10, 2025. View more MEME / TetherUS dynamics on the price chart.
See the list of crypto losers to find unexpected opportunities.
See the list of crypto losers to find unexpected opportunities.
The safest choice when buying MEME is to go to a well-known crypto exchange. Some of the popular names are Binance, Coinbase, Kraken. But you'll have to find a reliable broker and create an account first. You can trade MEME right from TradingView charts — just choose a broker and connect to your account.
Crypto markets are famous for their volatility, so one should study all the available stats before adding crypto assets to their portfolio. Very often it's technical analysis that comes in handy. We prepared technical ratings for MEME / TetherUS (MEME): today its technical analysis shows the sell signal, and according to the 1 week rating MEME shows the sell signal. And you'd better dig deeper and study 1 month rating too — it's sell. Find inspiration in MEME / TetherUS trading ideas and keep track of what's moving crypto markets with our crypto news feed.
MEME / TetherUS (MEME) is just as reliable as any other crypto asset — this corner of the world market is highly volatile. Today, for instance, MEME / TetherUS is estimated as 2.76% volatile. The only thing it means is that you must prepare and examine all available information before making a decision. And if you're not sure about MEME / TetherUS, you can find more inspiration in our curated watchlists.
You can discuss MEME / TetherUS (MEME) with other users in our public chats, Minds or in the comments to Ideas.