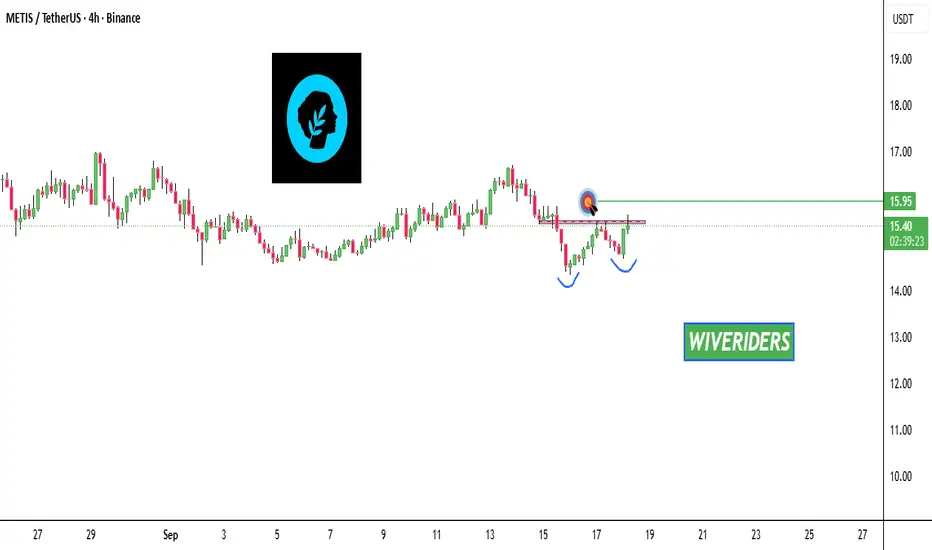
METIS has formed a bullish double bottom 📊 SEED_DONKEYDAN_MARKET_CAP:METIS Market Update
SEED_DONKEYDAN_MARKET_CAP:METIS has formed a bullish double bottom 📈
👉 If it breaks out the red resistance zone 🔴, the first target will be the green line level 🎯
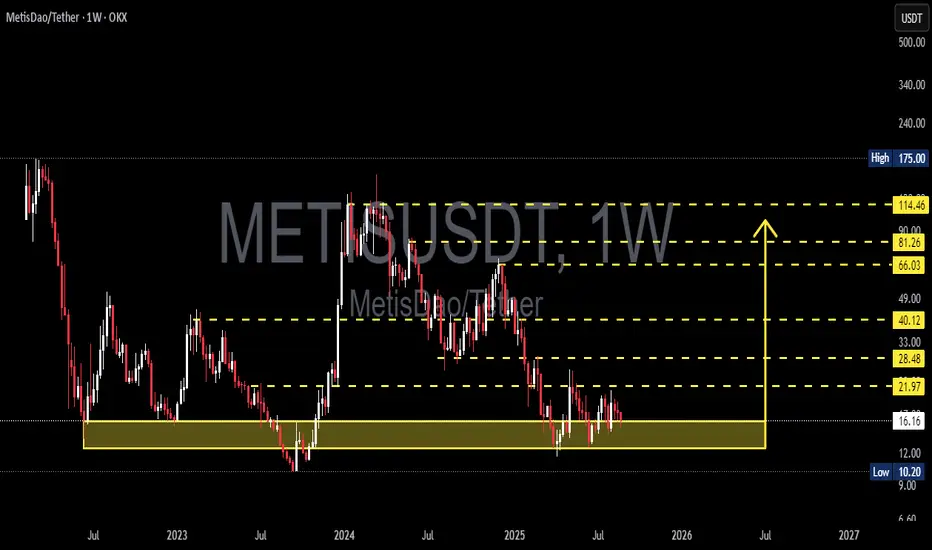
METIS/USDT — Major Accumulation or Breakdown Ahead?Currently, METIS/USDT is trading inside a very crucial demand zone at $10.20 – $16.16 (highlighted in yellow). This area has acted as strong support multiple times since 2022–2025, preventing deeper sell-offs. In other words, this is the last line of defense for buyers and a potential accumulation z
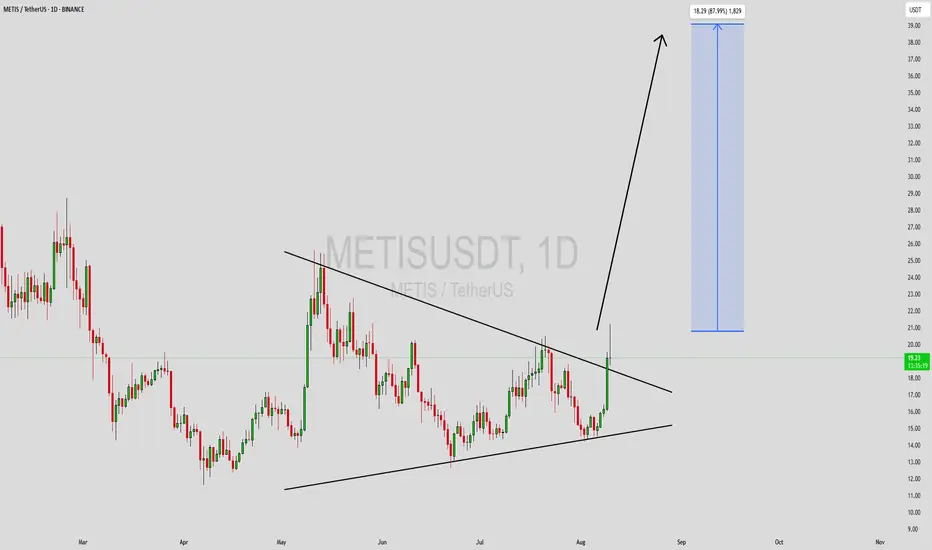
METISUSDT Forming Falling WedgeMETISUSDT is forming a well-defined falling wedge pattern, a classic bullish reversal setup indicating the downtrend may be nearing exhaustion. Price action has narrowed between descending support and resistance lines, signaling that selling pressure is fading and key levels are being defended by ac
METISUSDT 1W AnalysisMETIS ~ 1W Analysis
#METIS Buy back gradually from here if you still have confidence in this coin with a short term target of at least 20%+ from here.

Is $METISUSDT ready to move ??Following a breakout and retest of a resistance zone and now turning it to a support zone. BINANCE:METISUSDT seems to be ready for some bullish moves. So be on the look out as the expected targets are marked out already.
Kindly support this analysis to enable it reach to other people, and do comm

$METIS Breakout Complete – Retest in Progress!!SEED_DONKEYDAN_MARKET_CAP:METIS just completed a massive breakout and is now cooling off!
The downtrend is now over. The price broke through resistance and is currently re-testing important levels.
Two clear scenarios from here:
A bounce at the $21 level will initiate the next wave up.
A dip at

METIS Successfully breakout this resistant lineSuccessfully breakout this resistant line with a short -term target of at least 10%+.

Metisusdt buying opportunityMETISUSDT is consolidating within a long-term symmetrical triangle, with price currently testing a key demand zone around $23.00, a historically reactive level aligning with trendline support. Multiple liquidity taps at this area indicate strong accumulation interest, reinforced by RSI bouncing off

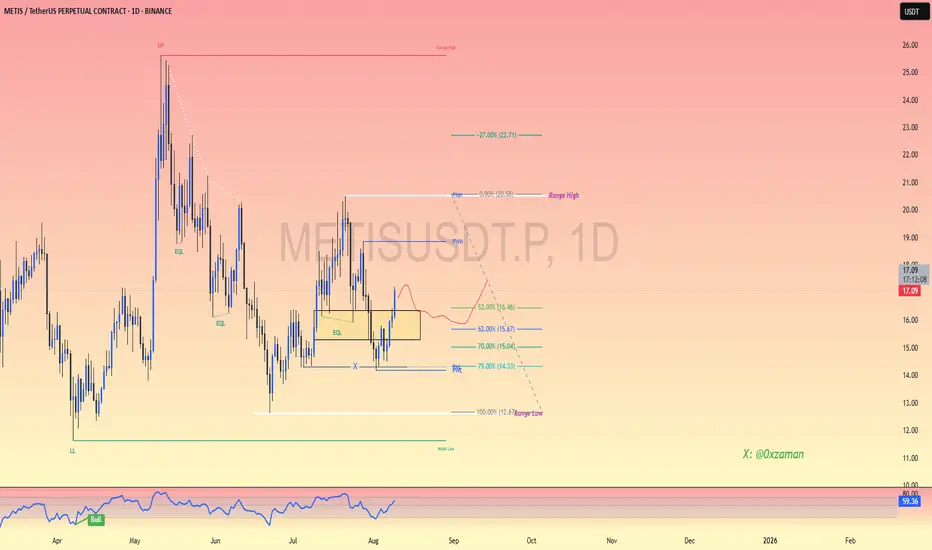
METIS LONGS /INVERSION📊 15-Minute Chart Analysis (METISUSDT.P) 🔍
Key Zones:
Liquidity Cluster (Left Side): Potential accumulation zone before price reversal.
Fair Value Gap (FVG): Marked in blue, indicating an area of imbalance that may act as a demand zone.
Fibonacci Levels:
0.618 (15.55)
0.786 (15.67) (Potential

See all ideas
Summarizing what the indicators are suggesting.
Oscillators
Neutral
SellBuy
Strong sellStrong buy
Strong sellSellNeutralBuyStrong buy
Oscillators
Neutral
SellBuy
Strong sellStrong buy
Strong sellSellNeutralBuyStrong buy
Summary
Neutral
SellBuy
Strong sellStrong buy
Strong sellSellNeutralBuyStrong buy
Summary
Neutral
SellBuy
Strong sellStrong buy
Strong sellSellNeutralBuyStrong buy
Summary
Neutral
SellBuy
Strong sellStrong buy
Strong sellSellNeutralBuyStrong buy
Moving Averages
Neutral
SellBuy
Strong sellStrong buy
Strong sellSellNeutralBuyStrong buy
Moving Averages
Neutral
SellBuy
Strong sellStrong buy
Strong sellSellNeutralBuyStrong buy
Displays a symbol's price movements over previous years to identify recurring trends.