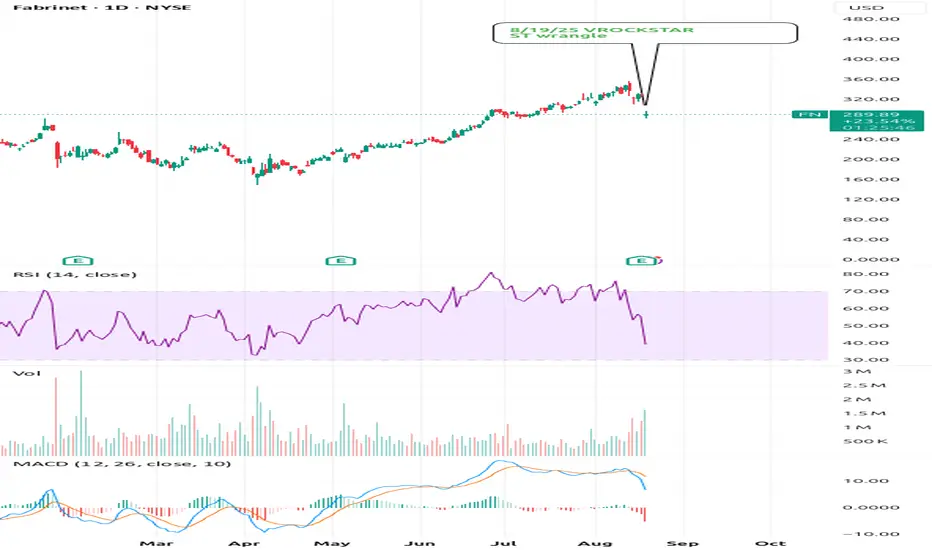
8/19/25 - $fn - ST wrangle8/19/25 :: VROCKSTAR :: NYSE:FN
ST wrangle
- not cheap, let's get that out of the way at ~30x PE still
- but 3% fcf yield, growing high teens and 10 bn cap and a lot of "future of chips and DC" runway to go
- great result, any hiccup will get looked thru
- stock has had a great run, so giving som
Fabrinet
No trades
Next report date
—
Report period
—
EPS estimate
—
Revenue estimate
—
9.0 EUR
282.28 M EUR
2.90 B EUR
35.67 M
About Fabrinet
Sector
Industry
CEO
Seamus Grady
Website
Headquarters
George Town
Founded
1999
IPO date
Jun 25, 2010
Identifiers
3
ISIN KYG3323L1005
Fabrinet engages in the provision of optical packaging and electronic manufacturing services to original equipment manufacturers. The firm's engineering services include process design, failure analysis, reliability testing, tooling design, and real-time traceability system. Its manufacturing operations offer sensors, subsystems, customized optics, and optical modules and components. The company was founded by David Thomas Mitchell on August 12, 1999 and is headquartered in George Town, Cayman Islands.
Related stocks
Fabrinet longI've placed this order already several days ago. WeÄve got a bullish crossover of SMA 30 and 50. Prive touches again a resistance area around the 50% Fibonacci retracement around 240 USD. I expect this to break to the upside and then add to my position.

FN @ Inflection PointNYSE:FN parked at an inflection spot ahead of FOMC tomorrow.
I already have a position. Chance to size up if conditions tomorrow favors doing so.

$FN sets up a pivotFollwing surprise earnings and an upgrade to Buy, NYSE:FN is setting up a pivot for continued price expansion. Let the market digest recent gains for a while and we should see re-ignited moves soon.


McMillan Volatility Band Buy Signal in Fabrient $FNConfirmed buy signal in Fabrinet, ticker: FN. Initial stop set at 53.50. More information on this indicator is available at the link on our profile.

FN - more than 10% decline aheadFabrinet seems to have finished minor wave 2 up and should begin wave 3 of intermediate 3. This move should show a good strength and prices should reach more than 10% of decline and up to the most probable first stop target at 48.25. If prices cross up 62.60 this analysis should be reviewed. FOLLOW

Fabrinet - started to trace wave 3 downFN is finishing subminuette wave 1 from intermediate wave 3 down. It could have a counter-trend move up up to around 63.00 before continuing its trend down to levels below 45.00. If prices crosses up 67.00, this analysis should be reviewed. FOLLOW SKYLINEPRO TO GET UPDATES.

See all ideas
Summarizing what the indicators are suggesting.
Neutral
SellBuy
Strong sellStrong buy
Strong sellSellNeutralBuyStrong buy
Neutral
SellBuy
Strong sellStrong buy
Strong sellSellNeutralBuyStrong buy
Neutral
SellBuy
Strong sellStrong buy
Strong sellSellNeutralBuyStrong buy
An aggregate view of professional's ratings.
Neutral
SellBuy
Strong sellStrong buy
Strong sellSellNeutralBuyStrong buy
Neutral
SellBuy
Strong sellStrong buy
Strong sellSellNeutralBuyStrong buy
Neutral
SellBuy
Strong sellStrong buy
Strong sellSellNeutralBuyStrong buy
Displays a symbol's price movements over previous years to identify recurring trends.
Frequently Asked Questions
The current price of 1FN is 412.2 EUR — it has decreased by −0.43% in the past 24 hours. Watch Fabrinet stock price performance more closely on the chart.
Depending on the exchange, the stock ticker may vary. For instance, on MIL exchange Fabrinet stocks are traded under the ticker 1FN.
1FN stock has risen by 10.66% compared to the previous week, the month change is a −4.06% fall, over the last year Fabrinet has showed a 136.90% increase.
We've gathered analysts' opinions on Fabrinet future price: according to them, 1FN price has a max estimate of 507.79 EUR and a min estimate of 382.54 EUR. Watch 1FN chart and read a more detailed Fabrinet stock forecast: see what analysts think of Fabrinet and suggest that you do with its stocks.
1FN stock is 6.31% volatile and has beta coefficient of 1.66. Track Fabrinet stock price on the chart and check out the list of the most volatile stocks — is Fabrinet there?
Today Fabrinet has the market capitalization of 13.95 B, it has increased by 10.98% over the last week.
Yes, you can track Fabrinet financials in yearly and quarterly reports right on TradingView.
Fabrinet is going to release the next earnings report on May 11, 2026. Keep track of upcoming events with our Earnings Calendar.
1FN earnings for the last quarter are 2.86 EUR per share, whereas the estimation was 2.77 EUR resulting in a 3.41% surprise. The estimated earnings for the next quarter are 2.99 EUR per share. See more details about Fabrinet earnings.
Fabrinet revenue for the last quarter amounts to 964.56 M EUR, despite the estimated figure of 917.09 M EUR. In the next quarter, revenue is expected to reach 996.94 M EUR.
1FN net income for the last quarter is 95.89 M EUR, while the quarter before that showed 81.75 M EUR of net income which accounts for 17.30% change. Track more Fabrinet financial stats to get the full picture.
No, 1FN doesn't pay any dividends to its shareholders. But don't worry, we've prepared a list of high-dividend stocks for you.
As of Feb 13, 2026, the company has 16.46 K employees. See our rating of the largest employees — is Fabrinet on this list?
EBITDA measures a company's operating performance, its growth signifies an improvement in the efficiency of a company. Fabrinet EBITDA is 373.54 M EUR, and current EBITDA margin is 11.07%. See more stats in Fabrinet financial statements.
Like other stocks, 1FN shares are traded on stock exchanges, e.g. Nasdaq, Nyse, Euronext, and the easiest way to buy them is through an online stock broker. To do this, you need to open an account and follow a broker's procedures, then start trading. You can trade Fabrinet stock right from TradingView charts — choose your broker and connect to your account.
Investing in stocks requires a comprehensive research: you should carefully study all the available data, e.g. company's financials, related news, and its technical analysis. So Fabrinet technincal analysis shows the strong buy rating today, and its 1 week rating is buy. Since market conditions are prone to changes, it's worth looking a bit further into the future — according to the 1 month rating Fabrinet stock shows the buy signal. See more of Fabrinet technicals for a more comprehensive analysis.
If you're still not sure, try looking for inspiration in our curated watchlists.
If you're still not sure, try looking for inspiration in our curated watchlists.