IQV - BUY ON DIPS IQV - CURRENT PRICE : 184.08
From May to July, IQVIA (IQV) staged a strong upward rally, supported by rising volume. Following this advance, the stock underwent a healthy retracement, consolidating recent gains without breaking its long-term uptrend. Take note that the up trendline is still inta
Next report date
—
Report period
—
EPS estimate
—
Revenue estimate
—
6.25 EUR
1.33 B EUR
14.88 B EUR
168.79 M
About IQVIA Holdings, Inc.
Sector
Industry
CEO
Ari Bousbib
Website
Headquarters
Durham
Founded
1950
ISIN
US46266C1053
FIGI
BBG01TNXRC83
IQVIA Holdings, Inc. engages in the provision of analytics, technology solutions, and clinical research services to the life sciences industry. It operates through the following segments: Technology and Analytics Solutions, Research and Development Solutions, and Contract Sales and Medical Solutions. The Technology and Analytics Solutions segment supplies mission critical information, technology solutions, and real-world solutions and services to the firm's life science clients. The Research and Development Solutions segment provides outsourced clinical research and clinical trial related services. The Contract Sales and Medical Solutions segment offers health care provider and patient engagement services to both biopharmaceutical customers and the healthcare market. The company was founded by Dennis B. Gillings and Gary Koch in 1982 and is headquartered in Durham, NC.
Related stocks

Option Alert: $IQV NOV 21 2025 $210 Calls – 138% ROI Potential Enter: NYSE:IQV NOV 21 2025 $210 CALLS
Buy in Price: $9.10 - $9.35
Take Profit: $22.25
Stop Bleeding: $8.23
ROI Potential: 138%
Exit Within: 3 Weeks

Trend Break Sparks Momentum.
IQVIA has recently broken its long-term downtrend, showing renewed momentum.
The company's solid growth prospects and attractive valuation multiples support further upside.
With this momentum shift, I expect a move toward the $225 level.
However, before entering a position, I want to see green H

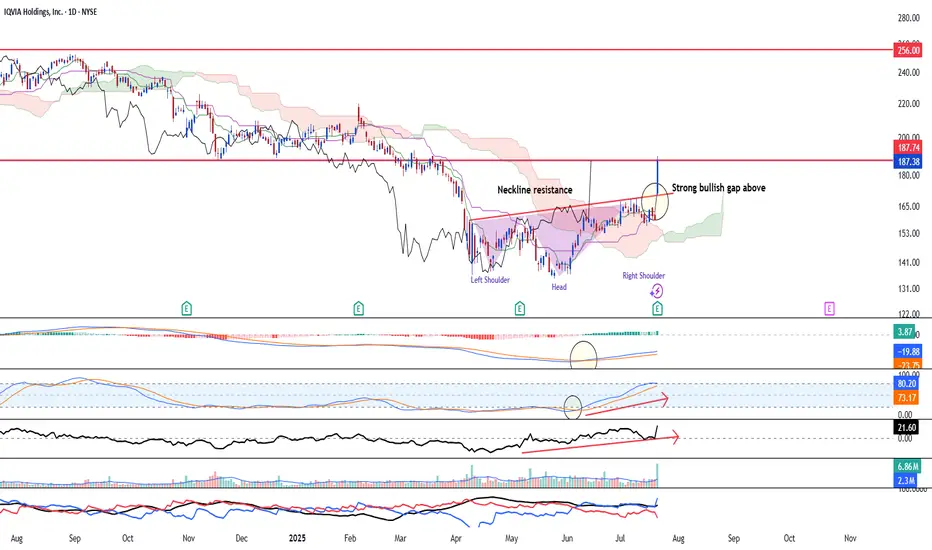
Bottoming out confirmed after inverted HnS confirmedNYSE:IQV bottoming out bullish reversal is confirmed after all indicators see strong bullish momentum.
Ichimoku shows a three bullish golden cross and the strong bullish gap up above the neckline resistance of the inverted head and shoulder speaks of strong reversal.
MACD has come back as MACD/
$IQV, Long, Risk=1/3, TP>15%NYSE:IQV , Long, Risk=1/3, TP>15%
Fundamentally the stock is good.
Choose an entry point and do not forget about a protective order if you are trading with leverage.
Don't risk it if you're not sure.
Good luck to everyone.

IQVIA (Daily) downsideSizeable insider sales in March and August 2024 (maybe due to the financial strength and liquidity ratios of this company appearing lacklustre), makes me think more downside on the horizon.

IQV - BullishIQV is now trying to find its momentum and move up to the 249 area. You have to be mindful of the resistance above and if you are trading options, make sure to give yourself some time. Its a game of probabilities and the probabilities for this ticker are lining up for a bullish outlook.
Good luck.


$IQV with a Bullish outlook following its earnings #Stocks The PEAD projected a Bullish outlook for $IQV after a Negative over reaction following its earnings release placing the stock in drift C with an expected accuracy of 57.14%.

IQV - H&S Continuation Pattern H&S patterns can be seen to form and lead to new highs once finished forming
Two have been seen so far, and the left shoulder has formed on the third so far
This third will form and lead to new highs

See all ideas
Summarizing what the indicators are suggesting.
Neutral
SellBuy
Strong sellStrong buy
Strong sellSellNeutralBuyStrong buy
Neutral
SellBuy
Strong sellStrong buy
Strong sellSellNeutralBuyStrong buy
Neutral
SellBuy
Strong sellStrong buy
Strong sellSellNeutralBuyStrong buy
An aggregate view of professional's ratings.
Neutral
SellBuy
Strong sellStrong buy
Strong sellSellNeutralBuyStrong buy
Neutral
SellBuy
Strong sellStrong buy
Strong sellSellNeutralBuyStrong buy
Neutral
SellBuy
Strong sellStrong buy
Strong sellSellNeutralBuyStrong buy
Frequently Asked Questions
The current price of 1IQV is 200.70 EUR — it has increased by 1.06% in the past 24 hours. Watch IQVIA Holdings Inc stock price performance more closely on the chart.
Depending on the exchange, the stock ticker may vary. For instance, on MIL exchange IQVIA Holdings Inc stocks are traded under the ticker 1IQV.
1IQV stock has risen by 5.80% compared to the previous week, the month change is a 8.05% rise, over the last year IQVIA Holdings Inc has showed a 53.15% increase.
We've gathered analysts' opinions on IQVIA Holdings Inc future price: according to them, 1IQV price has a max estimate of 229.32 EUR and a min estimate of 173.07 EUR. Watch 1IQV chart and read a more detailed IQVIA Holdings Inc stock forecast: see what analysts think of IQVIA Holdings Inc and suggest that you do with its stocks.
1IQV reached its all-time high on Nov 21, 2025 with the price of 197.10 EUR, and its all-time low was 119.90 EUR and was reached on May 23, 2025. View more price dynamics on 1IQV chart.
See other stocks reaching their highest and lowest prices.
See other stocks reaching their highest and lowest prices.
1IQV stock is 1.05% volatile and has beta coefficient of 0.80. Track IQVIA Holdings Inc stock price on the chart and check out the list of the most volatile stocks — is IQVIA Holdings Inc there?
Today IQVIA Holdings Inc has the market capitalization of 34.05 B, it has increased by 4.34% over the last week.
Yes, you can track IQVIA Holdings Inc financials in yearly and quarterly reports right on TradingView.
IQVIA Holdings Inc is going to release the next earnings report on Feb 18, 2026. Keep track of upcoming events with our Earnings Calendar.
1IQV earnings for the last quarter are 2.56 EUR per share, whereas the estimation was 2.54 EUR resulting in a 0.59% surprise. The estimated earnings for the next quarter are 2.93 EUR per share. See more details about IQVIA Holdings Inc earnings.
IQVIA Holdings Inc revenue for the last quarter amounts to 3.49 B EUR, despite the estimated figure of 3.48 B EUR. In the next quarter, revenue is expected to reach 3.66 B EUR.
1IQV net income for the last quarter is 282.08 M EUR, while the quarter before that showed 225.81 M EUR of net income which accounts for 24.92% change. Track more IQVIA Holdings Inc financial stats to get the full picture.
No, 1IQV doesn't pay any dividends to its shareholders. But don't worry, we've prepared a list of high-dividend stocks for you.
As of Nov 28, 2025, the company has 88 K employees. See our rating of the largest employees — is IQVIA Holdings Inc on this list?
EBITDA measures a company's operating performance, its growth signifies an improvement in the efficiency of a company. IQVIA Holdings Inc EBITDA is 2.89 B EUR, and current EBITDA margin is 21.96%. See more stats in IQVIA Holdings Inc financial statements.
Like other stocks, 1IQV shares are traded on stock exchanges, e.g. Nasdaq, Nyse, Euronext, and the easiest way to buy them is through an online stock broker. To do this, you need to open an account and follow a broker's procedures, then start trading. You can trade IQVIA Holdings Inc stock right from TradingView charts — choose your broker and connect to your account.