MHK | Long Setup | Weekly triangle | Sep 10, 2025📌MHK | Long Setup | Weekly triangle + cost reset & buybacks | Sep 10, 2025
🔹 Thesis Summary
Mohawk is compressing inside a multi-year symmetrical triangle while management executes a cost reset and buybacks. At ~$135, the stock trades at a discount to home-improvement peers; a weekly close through the down-trend unlocks rerating potential into 2026.
🔹 Trade Setup
Bias: Long
Entry Zone: $132–$136 (initial scale) — Add-on: weekly close ≥ $138–$140
Stop Loss: $124 (weekly close below triangle support) — Hedge level: $95 (defensive stop/puts if breached)
Sizing / Risk: Chart risk box → Max absolute $3.15M, Relative $1.77M (align to your risk cap; target ≥3:1 R:R to TP2)
Take-Profits:
TP0 (10% trim): $138–$139 (first supply retest)
TP1: $150 (2024 swing high) — ~1.6 R:R from $134
TP2: $206 (2017–2021 shelf) — ~7.2 R:R
TP3: $230–$246 (measured move / extension)
Max Target: $333–$496 (cycle objective; ROI potential ~324% on full extension)
🔹 Narrative & Context
Structure: Price has coiled for years between ~$98–$164 (52-wk range $98–$161). Higher lows since 2023 and tightening volatility favor a directional move.
Operational reset: 2025 restructuring benefits targeted at $100M; $500M new repurchase authorization (Q2 2025) with conservative leverage (~1.1× exiting 2024).
Tariff headwind but addressed: LVT duties (~$50M annualized) are being offset via price/mix and supply shifts.
Flow of news: Q2’25 EPS $2.34 on flat ~$2.8B sales; FCF $125M. Leadership transition underway; cadence of 10-Q/8-K updates supports transparency.
🔹 Valuation & Context (Pro Metrics, Framed Simply)
Forward P/E ≈ 12.8× vs LOW 20.1× / HD 25.5× / TILE 14.2× / RH 16.3× → Cheaper than big-box peers and near specialty medians → Market pricing cyclical risk → If margins normalize, multiple can expand alongside earnings.
P/FCF ≈ 17.5× (FCF Yield ~5.7%) vs LOW ~19.5×, HD ~29×, SHW ~41× → More cash per dollar paid → Supports buybacks and cushions downside during slow demand.
EPS Next Y +16.9% vs peer medians ~10–13% → Operating improvements visible → Aligns with a breakout thesis.
Balance-sheet risk: Net leverage ~1.1× → Conservative → Flexibility to keep investing and repurchasing through the cycle.
🔹 Contrarian Angle (Your Edge)
Street targets cluster around $136 with mixed Buy/Hold stances. The market is anchoring to soft housing turnover. The chart shows multi-year accumulation into a triangle apex while fundamentals inflect (cost-outs + buybacks). We see a credible path to $150 near-term and $206–$246 into 2026, with a long-cycle stretch toward $333.
🔹 Risks
Prolonged housing softness / R&R slowdown.
Tariff or input-cost escalation compresses margins.
Execution risk on restructuring and leadership transition.
🔹 Macro Considerations
Watch U.S. mortgage rates & housing starts, USD (import costs), and cyclical factor flows. A broad risk-off in consumer cyclicals could delay breakout timing; conversely, easing rates or improving housing turnover accelerates the move.
🔹 Bottom Line
A discounted multiple, tangible cost actions, and repurchases create an asymmetric long with defined risk at $124. A weekly close above $138–$140 is the trigger; $150 / $206 are the first meaningful checkpoints for a rerating.
🔹 Forward Path
If this post gains traction, I’ll follow up with: weekly structure updates, breakout confirmation levels, and revisions to targets as margins and volumes evolve.
👉 Like & Follow for structured ideas, not signals. I post high-conviction setups here before broader narratives play out. If this hits 🔟 likes, I’ll follow up!
⚠️ Disclaimer: This is not financial advice. Do your own research. Charts and visuals may include AI enhancements.
🔹 Footnote
Forward P/E: Price divided by expected earnings over the next 12 months. Lower = cheaper relative to profits.
P/FCF (Price-to-Free-Cash-Flow): Price vs. the cash left after investments. A measure of efficiency.
FCF Yield: Free cash flow per share ÷ price per share. Higher = more cash returned for each dollar invested.
ROE (Return on Equity): Net income ÷ shareholder equity. Shows management efficiency with investor capital.
ROIC (Return on Invested Capital): Net income ÷ all invested capital (equity + debt). A purer profitability gauge.
Debt/Equity: Debt divided by equity. <1 usually means balance sheet is conservative.
R:R (Risk-to-Reward): Ratio of expected upside vs. downside. 3:1 = you risk $1 to make $3.
Mohawk Industries, Inc.
No trades
Trade ideas


162 resistence W forming for bullish breakoutA W shape forming on the Daily. This could be a bullish move to test the high from before its correction.

MHK SHORT / LONG 041824I like Mohawk Industies a little lower to go long. There is a FVG around $100 per share and I would set an alert to go long at that position.
If you wish to go short in the next 2 weeks, I would tread carefully and exit with a quick TP.
Otherwise setup an alert for price to reach $102 and hit buy from there.
Happy Trading,

longBuy at retest area.Classic! Wyckoff
Price broke resistance and retest the resistance turns support area

#MHK two-cause resistance levelFirst reason:
An analysis of options trading results from the previous trading session revealed abnormal trading volume at strike 110, significantly higher than the average #MHK option trading volume( more than 1000% of average)
Second:
The analysis of the graphs indicates that there is a significant amount of buying activity at the price level (indicated on the chart). This will likely lead to a resurgence of buying activity when we approach that level again, thereby generating the necessary liquidity to initiate counter positions on the side of the SMART MONEY.

MOHAWK INDUSTRIES, INC trading signal MOHAWK INDUSTRIES, INC Buy long signal @128.15
Trading ideas every day at investsy.io/#/signals

Mohawk Industries (NYSE: $MHK) Sitting In Golden Pocket! 🚧Mohawk Industries, Inc. designs, manufactures, sources, distributes, and markets flooring products for remodeling and new constructions of residential and commercial spaces in the United States, Europe, Russia, and internationally. It operates through three segments: Global Ceramic, Flooring North America (Flooring NA), and Flooring Rest of the World (Flooring ROW). The Global Ceramic segment provides a range of ceramic tile, porcelain tile, and natural stone products; and sources, markets, and distributes other tile related products. This segment markets and distributes its products under the American Olean, Daltile, Eliane, EmilGroup, KAI, Kerama Marazzi, Marazzi, and Ragno brands. The Flooring NA segment offers floor covering product lines in a range of colors, textures, and patterns, including carpets, carpet tiles, rugs and mats, carpet pads, hardwood, laminate, medium-density fiberboards, luxury vinyl tiles (LVT), and sheet vinyl products. This segment markets and distributes its flooring products under the Aladdin Commercial, Durkan, IVC, Karastan, Mohawk, Mohawk Group, Mohawk Home, Pergo, Portico, and Quick-Step brands. The Flooring ROW segment provides wood flooring and vinyl flooring, as well as laminates, roofing elements, sheet vinyl, LVT, insulation boards, medium-density fiberboards, chipboards, and other woods products under the Feltex, Godfrey Hirst, Hycraft, IVC Commercial, IVC Home, Leoline, Moduleo, Pergo, Quick-Step, and Unilin and Xtratherm brands; and licenses its intellectual property to flooring manufacturers. Mohawk Industries, Inc. was incorporated in 1988 and is headquartered in Calhoun, Georgia.

MHKMohawk Industries Inc. the world's largest manufacturer of flooring for residential and commercial markets. The company manufactures a wide range of ceramic tiles, porcelain tile, natural stone tiles, carpet tiles, carpets, carpet cushions, laminate and vinyl products, and more. Mohawk is a major supplier of all major flooring categories with manufacturing operations in 18 countries and sales in more than 170 countries.
The company's shares are at an interesting level of 145, which corresponds to 0.5 fibo not in the logarithm and 0.382 in the logarithm. On the daily chart, we see strong and extended bullish divergences. On the weekly chart, the RSI is already close to the zone below 30, but is probably still going down.
And this means that we can go to 137 and 124. It is problematic to determine the level in the current market exactly here, it is easier to indicate the range.
From the point of view of wave analysis, there is no particular point in arguing, this may already be the final c, or maybe 3k only in wave a, we will later understand the structure more clearly. For now, it's enough that we understand the importance of the range and the likely end of the stock's correction.
You can buy back from here, if only you are ready for a possible drawdown


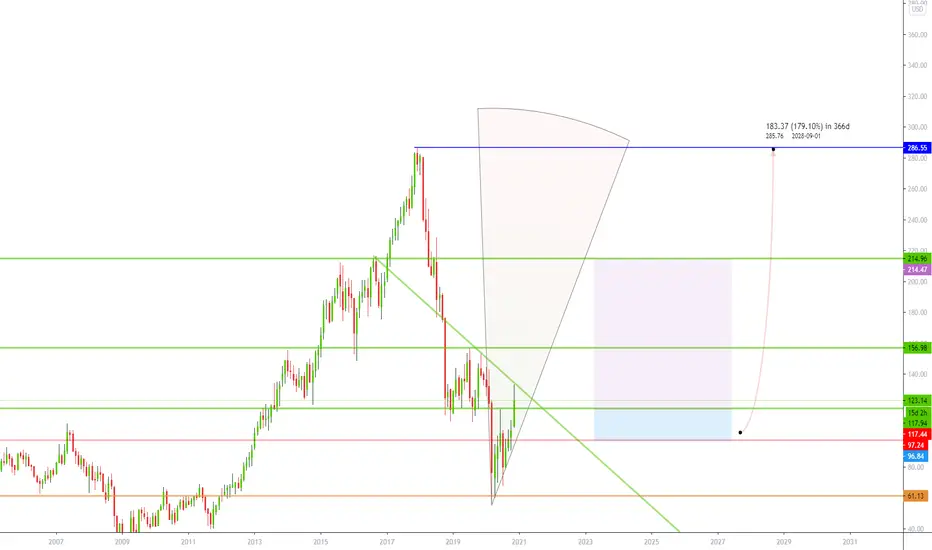
Mohawk is oversold. Is this one ready to run up?I have changed up how to best display projected movement. In the case of MHK, 4 of my algorithms signaled a BUY on March 24, 2021. Equities nearly always obey the signal and move up, but sometimes it may continue to move down first.
I have placed two red boxes and two green boxes on the chart. The larger red box depicts all of the historical movement, from a percentage standpoint, that this stock has moved on the 3 Hour chart after a BUY signal occurred. Therefore, this box represents 100% of previous movement downward before the stock finally moved upward. The smaller red box represents 50% of all historical movement downward, before the stock moved upward. The smaller box is more of a precise target for the potential bottom in this instance.
The green boxes represent the same thing. In this instance, the smaller green box would be my projected target for the final top.
The black dotted arrow represents median historical movement. Medians are a good metric, but they are just one of many I use when forecasting future movement.
As always, the stock could rise the very next bar after the signal without looking back (therefore the red boxes would not come into play) or the stock may never rise (and the green boxes may never come into play).
All statistics and the full analysis are available for free as always at the site below.

US Stock In Play: $MHK (Mohawk Industries Inc)$MHK displayed a open drive pattern, gapping up from $159.71 to $168.04 during the second week of February trading week. The share price further soared to this week's high of $185.85, before tumbling to a low of $168.1 as Federal Reserve Chairman comments this morning reignite global stock jitters.
At the current junction, $MHK remains supported by its 20DMA, with a potential pivotal towards a new 52 weeks high.
$MHK designs, manufactures, sources, distributes, and markets flooring products for remodeling and new constructions of residential and commercial spaces in the United States, Europe, Russia, and internationally.

Mohawk Industries Signal nice little entry point at Mohawk Industries , could run to a new High from here

Big Potential for MOHAWK INDUSTRIES Hey traders, MOHAWK INDUSTRIES is in a bullish push with a hammer candle shape and strong sell volume issued. The TIMEFRAME M1 shows a marubozu with a low voume traded it goes towards the base for testing. Then after the highest before she will test the top of the consolidation zone. Big possibility of breaking the price with the return of buying momentum then the zone to come into another and arrive on the top which comes with two excesses (on the TIMEFRAME H4).
Then four excesses (on TIMEFRAME H1) + re-test of the top of the bullish channel for pull back addition of a symbolic number of 152.00.
Please LIKE & FOLLOW, thank you!

Touching Support of Ascending Triangle Pull Back fishingDown today
I am sure it can also go back in to the A triangle as well if it drops 1 dollar further
Trading is a gamble!
Buy red/sell green
NV is very high on this one
Beware/A triangles can bust (fail )
Not a recommendation

$MHK Mohawk May be Vulnerable News-flow involving the SEC and Lawsuits is exactly what shorts look for ,
lets see how intense the selling could be today as the stock has already capitulated to a certain extent


MHK on the Way to a Short Target of $60Mohawk Industries NYSE:MHK seems to be on the way to a long-term short target of $60, based on a 1:1 ratio projection from the $286.85 top in 2017.

WindowAfter the steep fall yesterday we've opened with a downgap today. That's why I expect a further decline.

Contains Market AnalysisThis This Market Analysis And Is Directly Related To Current Market Conditions.

MHK - Long IdeaMight trade sideways in the very near term; but risk/reward looks appealing here given technical setup.
