272.30This channel is not providing individualized trading or investment advice, nor is it a banking service, brokerage service, trading service, investment service or money management service
Key facts today
Next report date
—
Report period
—
EPS estimate
—
Revenue estimate
—
12.7 EUR
−1.13 B EUR
447.69 M EUR
263.40 M
About Strategy Inc
Sector
Industry
CEO
Phong Q. Le
Website
Headquarters
Vienna
Founded
1989
ISIN
US5949724083
FIGI
BBG01QK6WKV1
Strategy, Inc. engages in the provision of enterprise analytics and mobility software. The firm designs, develops, markets, and sells software platforms through licensing arrangements and cloud-based subscriptions and related services. Its product packages include Hyper. The company was founded by Michael J. Saylor and Sanjeev K. Bansal on November 17, 1989, and is headquartered in Vienna, VA.
Related stocks

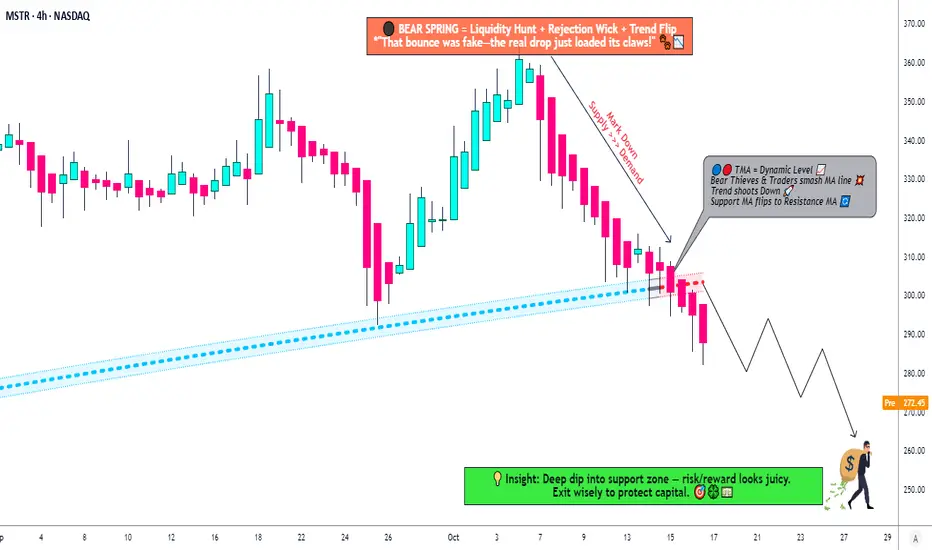
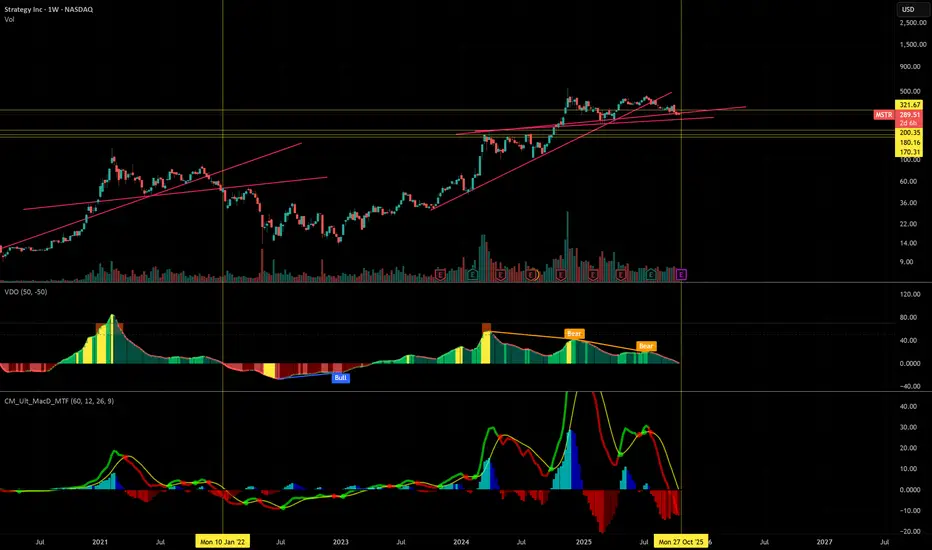
MSTR: Time to Short? Death Cross + Triangle Break Analysis🐻 MSTR "STRATEGY INC." - The Bear's Playground | Thief's Multi-Layer Setup 💰
📊 MARKET SNAPSHOT
Asset: NASDAQ:MSTR (Strategy Inc. - formerly MicroStrategy)
Current Price: ~$291.23 (Oct 17, 2025)
Setup Type: Swing/Day Trade - Bearish Confirmation
Strategy Style: "Thief Method" - Layered Limit Orders
Super high Reward Risk Ratio in MSTRAt 267, MSTR is at its long term trend line support.
As per ELliot wave it shows the end of corrective waves. Highly profitable entry setup with just 5% risk as stop loss.

Why the Eurodollar Market Became a Financial HavenIntroduction
The Eurodollar market stands as one of the most significant and transformative developments in modern finance. Despite its name, the term “Eurodollar” has little to do with Europe as a continent or the euro as a currency. Instead, it refers to U.S. dollar-denominated deposits held in b

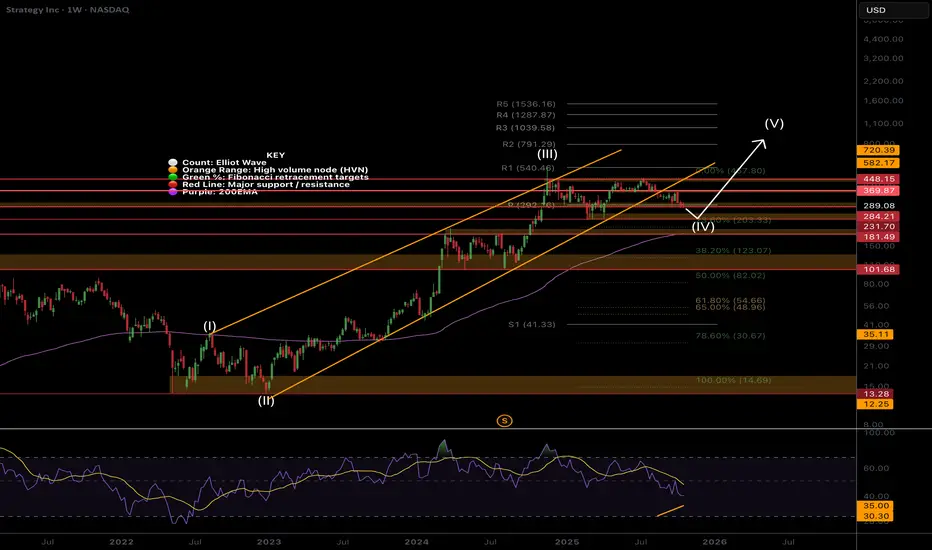
MSTR still in wave 4 rangeNASDAQ:MSTR Price is still in a wave (IV) which are expected to be long and drawn out, yet shallow which is what we have here. I don’t expect wave (V) to kick in until Bitcoin moves. Wave (V) has an expected of the R3 daily pivot at $1039 but will overextend if Bitcoin does.
Price has fallen out o
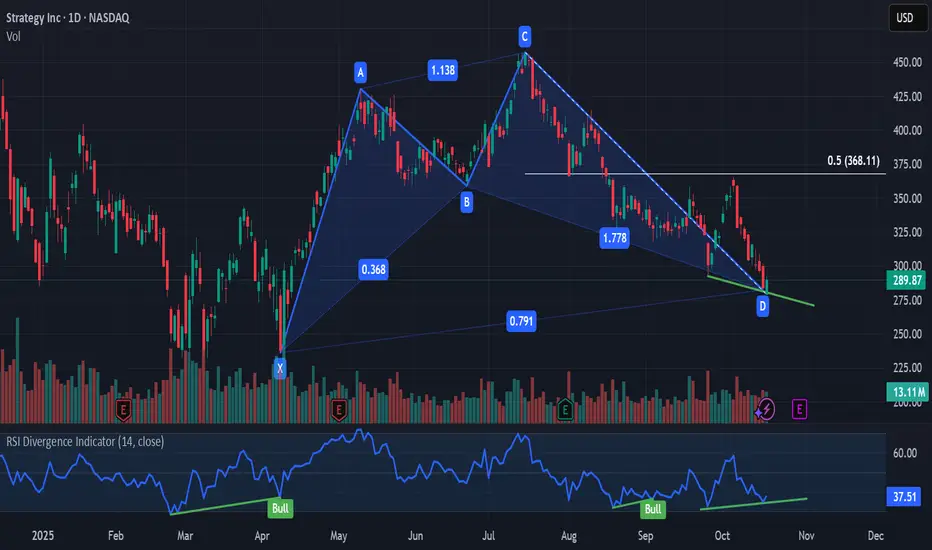
$MSTR bullish cypher patternBullish divergence on Cypher pattern PRZ with CRYPTOCAP:BTC currently trying to bounce during the weekend. possibly targeting 368.11
Measured Move to $1,100+The price had broken the channel twice in almost three years. November 2024 say a break up and out and the price has currently broken down and out, but still within the bullish wedge.
If the price were to break down and out of the wedge after breaking below the channel, that would likely trigger a

Strategy Inc. (MSTR)The stock is tied to the performance of Bitcoin, however, there seems to be a significant divergence in recent months. Handle with care.

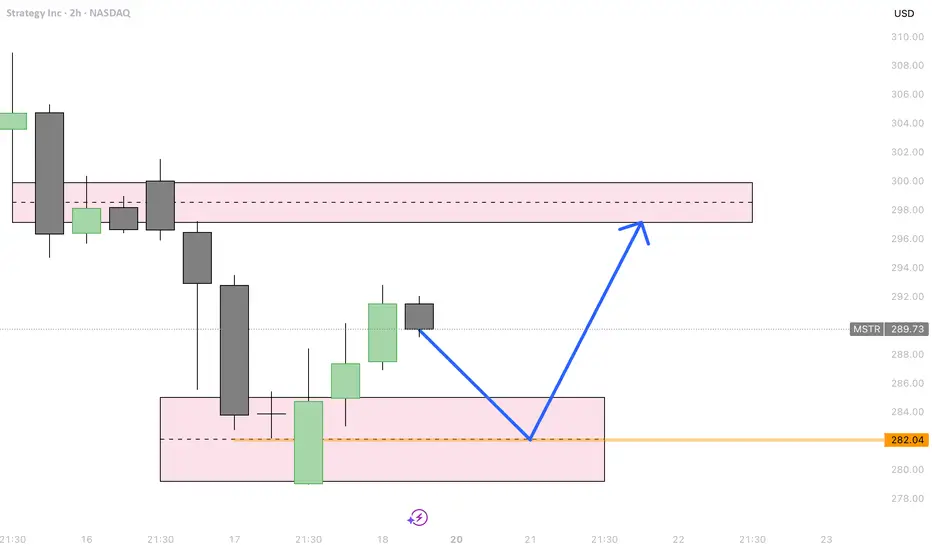
MSTR going lower before making the move upI am looking at NASDAQ:MSTR to make a lower move to a support zone which i see some orders at before moving higher. NASDAQ:MSTR movement has high correlation to $BTC. Seeing it go lower beofre moving up again.
If this looks bullish.. you got another thing coming History doesn't repeat itself, but it often rhymes. So far 1:1.
I reckon the next 356 days will test out Saylors holders
See all ideas
Summarizing what the indicators are suggesting.
Neutral
SellBuy
Strong sellStrong buy
Strong sellSellNeutralBuyStrong buy
Neutral
SellBuy
Strong sellStrong buy
Strong sellSellNeutralBuyStrong buy
Neutral
SellBuy
Strong sellStrong buy
Strong sellSellNeutralBuyStrong buy
An aggregate view of professional's ratings.
Neutral
SellBuy
Strong sellStrong buy
Strong sellSellNeutralBuyStrong buy
Neutral
SellBuy
Strong sellStrong buy
Strong sellSellNeutralBuyStrong buy
Neutral
SellBuy
Strong sellStrong buy
Strong sellSellNeutralBuyStrong buy
Displays a symbol's price movements over previous years to identify recurring trends.
XS2727408283
Canadian Imperial Bank of Commerce 0.0% 30-MAY-2030Yield to maturity
7.41%
Maturity date
May 30, 2030
XS2703700638
Canadian Imperial Bank of Commerce 6.62% 13-OCT-2038Yield to maturity
6.61%
Maturity date
Oct 13, 2038
CM5512020
Canadian Imperial Bank of Commerce 5.45% 09-DEC-2025Yield to maturity
6.33%
Maturity date
Dec 9, 2025
XS2659300185
Canadian Imperial Bank of Commerce 6.33% 28-JUL-2033Yield to maturity
6.33%
Maturity date
Jul 28, 2033
CM5677219
Canadian Imperial Bank of Commerce 6.3% 31-OCT-2033Yield to maturity
6.26%
Maturity date
Oct 31, 2033
CM5469145
Canadian Imperial Bank of Commerce 4.6% 31-AUG-2027Yield to maturity
6.13%
Maturity date
Aug 31, 2027
CM5721000
Canadian Imperial Bank of Commerce 6.15% 20-DEC-2038Yield to maturity
6.09%
Maturity date
Dec 20, 2038
XS2736028791
Canadian Imperial Bank of Commerce 6.04% 28-DEC-2043Yield to maturity
6.04%
Maturity date
Dec 28, 2043
CM5720336
Canadian Imperial Bank of Commerce 6.0% 19-DEC-2030Yield to maturity
6.02%
Maturity date
Dec 19, 2030
CM5514040
Canadian Imperial Bank of Commerce 5.8% 14-DEC-2027Yield to maturity
5.94%
Maturity date
Dec 14, 2027
CM5715043
Canadian Imperial Bank of Commerce 6.0% 08-DEC-2028Yield to maturity
5.94%
Maturity date
Dec 8, 2028
See all 1MSTR bonds
MSTE
Harvest MicroStrategy Enhanced High Income Shares ETF Trust Unit AWeight
126.91%
Market value
422.87 M
USD
Explore more ETFs
Curated watchlists where 1MSTR is featured.


Frequently Asked Questions
The current price of 1MSTR is 237.8 EUR — it has increased by 3.71% in the past 24 hours. Watch Strategy Inc Class A stock price performance more closely on the chart.
Depending on the exchange, the stock ticker may vary. For instance, on MIL exchange Strategy Inc Class A stocks are traded under the ticker 1MSTR.
1MSTR stock has fallen by −5.22% compared to the previous week, the month change is a −12.48% fall, over the last year Strategy Inc Class A has showed a −2.22% decrease.
We've gathered analysts' opinions on Strategy Inc Class A future price: according to them, 1MSTR price has a max estimate of 609.48 EUR and a min estimate of 151.29 EUR. Watch 1MSTR chart and read a more detailed Strategy Inc Class A stock forecast: see what analysts think of Strategy Inc Class A and suggest that you do with its stocks.
1MSTR reached its all-time high on Nov 21, 2024 with the price of 521.0 EUR, and its all-time low was 207.0 EUR and was reached on Nov 4, 2024. View more price dynamics on 1MSTR chart.
See other stocks reaching their highest and lowest prices.
See other stocks reaching their highest and lowest prices.
1MSTR stock is 4.77% volatile and has beta coefficient of 0.95. Track Strategy Inc Class A stock price on the chart and check out the list of the most volatile stocks — is Strategy Inc Class A there?
Today Strategy Inc Class A has the market capitalization of 62.40 B, it has increased by 2.08% over the last week.
Yes, you can track Strategy Inc Class A financials in yearly and quarterly reports right on TradingView.
Strategy Inc Class A is going to release the next earnings report on Feb 3, 2026. Keep track of upcoming events with our Earnings Calendar.
1MSTR earnings for the last quarter are 7.18 EUR per share, whereas the estimation was −0.09 EUR resulting in a 8.35 K% surprise. The estimated earnings for the next quarter are −0.07 EUR per share. See more details about Strategy Inc Class A earnings.
Strategy Inc Class A revenue for the last quarter amounts to 109.67 M EUR, despite the estimated figure of 99.41 M EUR. In the next quarter, revenue is expected to reach 102.71 M EUR.
1MSTR net income for the last quarter is 8.51 B EUR, while the quarter before that showed −3.90 B EUR of net income which accounts for 318.22% change. Track more Strategy Inc Class A financial stats to get the full picture.
No, 1MSTR doesn't pay any dividends to its shareholders. But don't worry, we've prepared a list of high-dividend stocks for you.
As of Nov 1, 2025, the company has 1.53 K employees. See our rating of the largest employees — is Strategy Inc Class A on this list?
EBITDA measures a company's operating performance, its growth signifies an improvement in the efficiency of a company. Strategy Inc Class A EBITDA is −22.17 M EUR, and current EBITDA margin is −5.29%. See more stats in Strategy Inc Class A financial statements.
Like other stocks, 1MSTR shares are traded on stock exchanges, e.g. Nasdaq, Nyse, Euronext, and the easiest way to buy them is through an online stock broker. To do this, you need to open an account and follow a broker's procedures, then start trading. You can trade Strategy Inc Class A stock right from TradingView charts — choose your broker and connect to your account.
Investing in stocks requires a comprehensive research: you should carefully study all the available data, e.g. company's financials, related news, and its technical analysis. So Strategy Inc Class A technincal analysis shows the sell today, and its 1 week rating is sell. Since market conditions are prone to changes, it's worth looking a bit further into the future — according to the 1 month rating Strategy Inc Class A stock shows the sell signal. See more of Strategy Inc Class A technicals for a more comprehensive analysis.
If you're still not sure, try looking for inspiration in our curated watchlists.
If you're still not sure, try looking for inspiration in our curated watchlists.