What Technical and Fundamental Analysis Says about NvidiaNvidia NASDAQ:NVDA soared nearly 20% Wednesday before pulling back some later in the week, leaving the stock down roughly 25% over the past six months. Where does technical and fundamental analysis say the chip giant’s stock could go from here?
Let’s take a look:
Nvidia’s Fundamental Analysis
Nvidia got a huge boost Wednesday from the Trump administration's decision to pause the tariffs it planned to impose on most nations’ U.S.-bound exports.
Instead, the White House decided to delay most tariffs on countries other than China for the next 90 days while it conducts trade negotiations with some 70 nations.
As an added benefit for Nvidia, the president's team separately paused an expected export ban that would have prohibited Nvidia from shipping its high-end H20 GPUs to China.
Now, I don't know how many of these chips Nvidia would really sell to Beijing, as both nations recently placed almost prohibitive tariffs on each other's exports.
But the market had probably already largely priced in the H20 export ban, which is now not moving ahead. The sale of these chips to Chinese customers in all likelihood remains legal.
Nvidia's publicly known Chinese customers for those chips include such well-known names as Alibaba NYSE:BABA , Tencent OTC:TCEHY and privately held ByteDance. All of those three have placed large H20 orders this year.
As for earnings, Nvidia won’t report fiscal Q1 results until probably May’s last week.
However, the firm posted fiscal Q4 numbers in February that showed 82% year-over-year earnings growth on 72% y/y revenue gains.
While those are big percentage increases, they nonetheless marked a deceleration from prior quarters’ y/y gains.
Similarly, management’s latest forward sales guidance remains strong, but also reflects a continuance of this year-over-year percentage deceleration.
The company’s midpoint projection calls for $43 billion in fiscal Q1 revenue, which would amount to about a 65% year-on-year revenue gain.
NVDA also guided fiscal Q1 GAAP gross margin to 70.6% and adjusted gross margin at 71%, plus or minus 50 basis points. That was just a touch below analysts’ consensus view at the time.
All in, the Street is looking for Nvidia to report $0.88 in GAAP earnings per share for its current quarter, as well as $0.93 in adjusted EPS and $43.3 billion in revenues.
That would represent an 52.5% gain from the year-ago quarter’s $0.61 in adjusted EPS, while also reflecting 64% in year-over-year sales growth.
This would beat of the firm's own guidance, as 25 of the 32 sell-side analysts that I can find that cover Nvidia have increased their estimates for the quarter since it began. (Seven have cut their forecasts.)
Technically Speaking
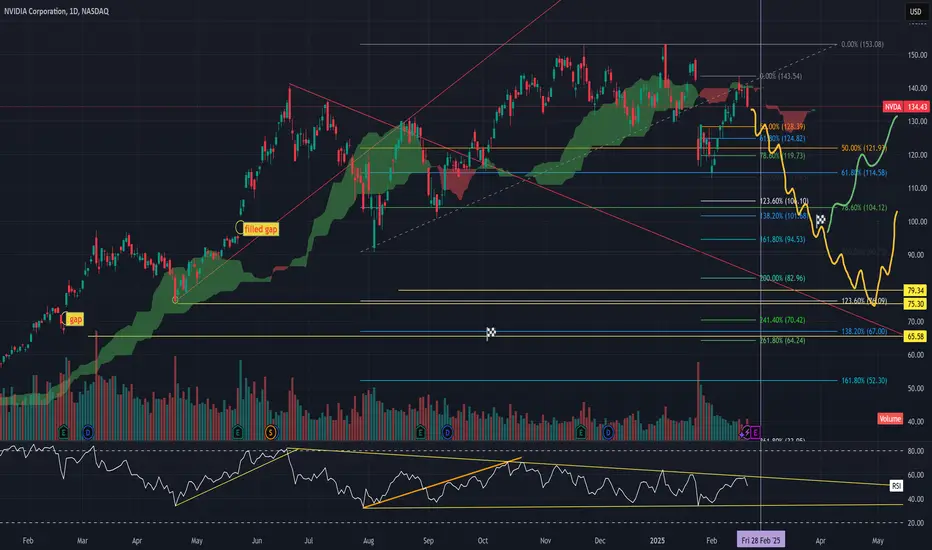
Now let’s check out NVDA’s chart going back to last September and running through midday on Thursday (April 10):
Readers will see that NVDA recently came out of a so-called “double top” pattern of bearish reversal that spanned from last October into early January, as marked with the “Top 1” and “Top 2” red boxes above.
However, the stock trended lower from that point on, as I capture above within the confines of an Andrews' Pitchfork model.
Though the chipmaker’s stock has at times pierced both the pitchfork’s upper and lower trendlines, it hasn’t broken out in either direction so far.
Even after NVDA’s 18.7% one-day rally on Wednesday, the stock immediately gave back its 21-day Exponential Moving Average (or “EMA,” marked with a green line above) on the very next day.
The stock also remains well below both its 50-day Simple Moving Average (or “SMA,” denoted by a blue line) and its 200-day SMA (marked with a red line).
This means that in all likelihood, Nvidia might very well remain an instrument of short-term trading rather than long-term investing. After all, portfolio managers generally don’t like to carry a lot of exposure below those two moving averages.
As for Nvidia’s other technical indicators, the stock’s Relative Strength Index (or “RSI,” marked with a gray line at the chart’s top) remains unimpressive.
Similarly, the company’s daily Moving Average Convergence Divergence indicator (or “MACD,” marked with the black and gold lines and blue bars at the chart’s bottom) looks bearish.
All of its three components -- the histogram of the 9-day EMA (the blue bars), the 12-day EMA (the black line) and the 26-day EMA (the gold line) -- are below zero. That’s usually a bearish technical indicator.
From where I stand, Nvidia’s upside pivot is the stock’s 50-day Simple Moving Average (or “SMA,” marked with a blue line and currently at around $119.30 vs. NVDA’s $107.57 close Thursday).
Meanwhile, if the stock can hold its 21-day EMA (the green line above, currently at about $109.90) that could get the swing-trading crowd on board.
However, a failure to hold there would likely make the odds of attracting capital flows from portfolio managers pretty weak.
(Moomoo Technologies Inc. Markets Commentator Stephen “Sarge” Guilfoyle had no position in NVDA at the time of writing this column.)
This article discusses technical analysis, other approaches, including fundamental analysis, may offer very different views. The examples provided are for illustrative purposes only and are not intended to be reflective of the results you can expect to achieve. Specific security charts used are for illustrative purposes only and are not a recommendation, offer to sell, or a solicitation of an offer to buy any security. Past investment performance does not indicate or guarantee future success. Returns will vary, and all investments carry risks, including loss of principal. This content is also not a research report and is not intended to serve as the basis for any investment decision. The information contained in this article does not purport to be a complete description of the securities, markets, or developments referred to in this material. Moomoo and its affiliates make no representation or warranty as to the article's adequacy, completeness, accuracy or timeliness for any particular purpose of the above content. Furthermore, there is no guarantee that any statements, estimates, price targets, opinions or forecasts provided herein will prove to be correct.
Moomoo is a financial information and trading app offered by Moomoo Technologies Inc. In the U.S., investment products and services on Moomoo are offered by Moomoo Financial Inc., Member FINRA/SIPC.
TradingView is an independent third party not affiliated with Moomoo Financial Inc., Moomoo Technologies Inc., or its affiliates. Moomoo Financial Inc. and its affiliates do not endorse, represent or warrant the completeness and accuracy of the data and information available on the TradingView platform and are not responsible for any services provided by the third-party platform.
Trade ideas

Support Zone: 106.19
Hello, traders.
If you "Follow", you can always get new information quickly.
Please click "Boost" as well.
Have a nice day today.
-------------------------------------
(NVDA Chart)
The HA-Low indicator on the 1D chart was formed at 106.19.
Therefore, the key is whether it can receive support and rise near 106.19.
-
(30m chart)
If it falls below 106.19,
1st: M-Signal indicator on 1M chart
2nd: HA-Low indicator on 30m chart
You need to check if it is supported near the 1st and 2nd above.
In order to continue the uptrend, the price must be maintained above the M-Signal indicator on the 1M chart.
-
(1D chart)
Since the HA-Low indicator on the 1D chart has been newly created, the key is whether it can be supported near this area and rise above the M-Signal indicator on the 1D chart.
If so, it is expected to turn into a short-term uptrend.
If not, there is a possibility of a stepwise downtrend, so the current position is an important section.
-
Thank you for reading to the end.
I hope your transaction will be successful.
--------------------------------------------------

NVIDIA - LongTrendchange indicated, High Volatility, still dangerous news leaded market, but what the information looks like now it is a long. Still if tarrifs not solved may change.

NVIDIA Corporation Will Start Growing (Recover) —New ATH In 2025I gave you the bad news but only because the market peaked and turned bearish. When the chart is bearish, I call it bearish. In reverse, when the chart turns bullish, I will share with you exactly what the share says.
All possible scenarios?
No! I will tell you the future before it happens...
Put your seatbelt on.
Join the ride.
Let's trade!
The markets today are not the same as they were 100 years ago. Today, bear markets are short, bull-markets are long.
Money is easily accessible now.
Companies that are in trouble do not have to go bankrupt. The system has many tools to protect the market and its participants. The business world and finance, continues to improve, advance and evolve. With time, bear markets will continue to become shorter while bull markets will continue to expand.
Prosperity and stability will be the norm.
Humanity is in an ascending trend. We are going up, worldwide, civilization wise...
The correction you saw between early January and today was the end. Three months going down and a total drop of 43% (-43%). That's it, NVDA is going up next.
NVDA produced a peak in June 2024. There was a correction and support was found at 91 in August. After some sideways, distribution, the drop was resumed and the same level activated again. NVDA bottomed yesterday at 92 and today it hit 86 but just to recover right away.
The recovery is really strong and also a positive signal. This recovery is happening on a Monday and is producing high volume. This is a long-term support level and it holds.
Minimum, we get a bounce now and prices move up because of this support. Once support is tested, the action moves back to resistance. By the time our previous resistance level is hit the market will be bullish and strong; interest rates will be lowered and in May we will have Mars (astrology) with a stabilized orbit, the action planet, which means that we will moving ahead with full force.
These signals combined are telling us that the down period is no more.
This is a friendly reminder: NVDA is going up.
I love you.
Thanks a lot for your continued support.
Namaste.


PEG @ 0.22 DEBT/ASSET @ 0.09 NVIDIA LOOKS CHEAP WITH SELL-OFFFundamental metrics favour NVIDIA and with the company's return on equity (ROE) stands above 119%, NVDA stock price looks irresistible below 105.
N.B!
- NVDA price might not follow the drawn lines . Actual price movements may likely differ from the forecast.
- Let emotions and sentiments work for you
- ALWAYS Use Proper Risk Management In Your Trades
#nvda
#nasdaq
#nyse

NVIDIA Update 3 Rangebound with new Low for longsIn this video I bring to your attention what we could possibly expect if we lose the current level and if we do then where is the next crucial zone to look for Longs.
If you have read this then pls do Boost my work and any questions then leave them below

Trade the range until it breaks Nvidia updateThis video is a quick recap on the previous video after the levels I gave produced 30% move to the upside after patiently waiting for the move down to 90$.
So what now is the big question after the unprecedented move we had yesterday .
I outline the next best Short/Long setup and define why I think we stay inside of the range until Earnings Data .

NVIDIA (NVDA): Oversold or Start of a Larger Correction?Overview & Market Context
NVIDIA just saw a major sell-off, dropping around 7% in a single session and slicing below key support levels. This abrupt move has raised questions: Is NVDA oversold enough for a bounce, or are we at the onset of a broader bearish trend? High trading volume suggests significant institutional distribution, so caution is warranted for both bulls and bears.
1. Price Action & Volume
* NVDA closed near the $94.31 mark after the sharp decline.
* Volume spiked (~532M), confirming that large players have been active—often a sign of heightened volatility and potential trend changes.
2. Moving Averages
* The 200-day SMA sits near $127.07, which NVDA fell below decisively. Historically, losing the 200-day often signals a medium-term bearish bias, making it a key level to watch on any rebound attempts.
3. RSI & Momentum
* The RSI on the daily timeframe is hovering around the high-20s, indicating oversold conditions. While this can lead to a short-term bounce, oversold can remain oversold if negative momentum persists.
Key Levels to Watch
Immediate Resistance:
* $96–$100 Range: Minor overhead supply; if price rallies here, watch to see if it rolls over again.
* $105–$110: This region aligns with prior support-turned-resistance. A strong push above $110 would challenge the bearish thesis.
Primary Support Targets
* $90 (Psychological Marker): Could be the first zone for a pause or bounce.
* $82.89 (“Half 1 Short” from algorithmic levels): A logical next stop if the sell-off continues.
* $76 Area: Deep support from earlier consolidation zones; if selling intensifies, the stock may reach these levels.
Potential Trade Setups
1. Bearish Continuation (Short)
Entry:
* On a weak bounce into the $96–$100 zone, or
* A breakdown below $94 on strong volume.
Stop Loss:
* Conservative approach: Above $105–$110, where a bullish reversal could invalidate the short setup.
Profit Targets:
* $90 (near-term psychological level),
* $82.89 (algorithmic short target),
* $76 (longer-term support).
2. Contrarian Bounce (Long)
* Entry: Around $90 or upon a clear intraday reversal signal (e.g., a bullish engulfing candle on strong volume).
* Stop Loss: Below $88 to reduce risk of a deeper flush.
* Profit Targets:
* $96–$100 (short-term push),
* Extended target near $105–$110 if momentum sharply reverses.
Thought Process & Strategy
* The extreme volume and steep decline reflect a high-conviction move. Usually, when you see volume spikes on a breakdown, it suggests institutional selling, meaning rallies may be met with further supply.
* However, the oversold reading (RSI in the high-20s) hints that a bounce might come soon—though it could be short-lived unless macro or fundamental conditions shift.
* Clearly defining both bullish and bearish scenarios—along with exact stop-loss levels—removes emotion and helps avoid “decision paralysis.” Trading is about probabilities, not certainties.
Final Notes
* Risk Management: Always size positions so that a single trade does not jeopardize your account.
* Emotional Control: These levels are algorithmically defined, aiming to reduce subjective bias. Watch how price reacts at each support/resistance zone.
* Stay Vigilant: With elevated volatility, rapid intraday swings are possible. Monitor real-time price action for confirmation.
Disclaimer: This is not financial advice. Perform your own due diligence, and trade responsibly.

Its crazy but possible Short $NVDA targeting 70sOf course it is difficult to short NVDA :) but watching RSI weakness and high volume with red candles suggest short term bearish trend or correction move - the stock in consolidation for almost a year - the idea is to short after earning report on Wednesday - Main supports at 113-104-94 strongest one then the gap at 70
NVDIAgain...long at 111.43This is gonna be my 6th long idea on NVDA since Mid-December. Sorry if this is getting boring, but if it keeps working, why stop?
It's not in a great pattern, but then again it wasn't the other 5 times, either. It has been in a downtrend since early December, but even stocks in downtrends don't have to go down in straight lines, and that's what I'm counting on here. There is some support semi-close by, too.
It's a good company, and trading them in tough times (I think the last 6 weeks qualifies there, don't you?) gives me the best odds of making money. NVDA has never let me down - literally never. Sometimes it takes longer than others, but it always pays. I haven't updated my W/L record on it lately, but the 5 trades on the chart are the last 5 I've made and it was undefeated before all of them. You can go back and look at them if you desperately want to know - I know it's in at least one of those but I don't feel like going back and looking for the exact number right now. I know it's at least 100s to 0. Edit: I felt bad being lazy so I went and looked it up. It's 722-0, and that's a good enough reason for me to trade it today.
So I'm long at 111.43, but I am making a little twist to my usual trade plan. I will be adding if it falls, but not using my usual methodology. It's a twist I've been working on for trading downtrending stocks. It's complicated, so I'll just update here whenever I add, and the adds will still be near the close when I make them. I will still use FPC (first profitable close) to exit any lot on the day it closes at any reasonable profit.
As always - this is intended as "edutainment" and my perspective on what I am or would be doing, not a recommendation for you to buy or sell. Act accordingly and invest at your own risk. DYOR and only make investments that make good financial sense for you in your current situation.

nvda 20% gain roughlyNVIDIA (NVDA) appears to be performing well, particularly following the 90-day tariff pause announced by former President Trump. This temporary suspension of tariffs may have positively impacted market sentiment and contributed to the company's strong performance.
nvda fake out looks like big moves happening today but i will be careful because ive seen this fake out before.we are at this moment not looking good watch out for a massive correction. hopefully im wrong and this is the bottom.

NVIDIA: Still has a long way to go.NVIDIA turned from oversold to neutral on its 1D technical outlook (RSI = 48.969, MACD = 44.021, ADX = 44.021) and is about to do the same on 1W too, as today's 90-day tariff pause announcement is giving the market an aggressive comeback. Technically though that doesn't seem enough to restore the tremendous bullish sentiment of 2023 and 1st half of 2024 as the trend is currently restricted by not only the 1D MA50 and MA200 but a LH trendline also coming straight from the ATH.
The same kind of LH kept NVDA at bay on its last main correction to the August 5th 2024 bottom. This started a +44.46% rally that got rejected on the LH trendline. If we apply that today we get a projected 1D MA200 test just under the LH trendline. A TP = 125.00 fits perfectly on the short term, but long term we still have a long way to go.
## If you like our free content follow our profile to get more daily ideas. ##
## Comments and likes are greatly appreciated. ##

Phase 4 broken, the hyperwave will be completedWe've seen this cycle across more or less in all kinds of assets. the MAG7 is no exception. As today, we've broken down from Phase 4, despise you like it or not, once these structures break down, PA(price action) will always find its way back to its true fair value.
Already called it, but this time, we get a closer look towards the TA in NVDA.
Sequentials are settled in, we're going for a 9 monthly count of sequential bars down, the intensity of the moves is yet to be known, but alas, we will have to look at SMA's and the range of the monthly Linear Regression, they all have supports around 80, 40, 20.
And as usual, be safe, don't long this.

We’ve seen a solid correction in NVDA - Bullish?We’ve seen a solid correction in NVDA following its rally since early 2024. The stock has broken through key levels and managed to hold within the resistance zone between $80 and $90. We will most likely enter a sideways movement until the situation regarding tariffs becomes clearer. This could extend into June, after which we might expect an upward move toward the $132.95 zone. By early 2026, we are likely to see a new all-time high, especially if the trade tensions and tariffs between China and the US are resolved and overall uncertainty decreases.

NVDA 09-04-2025NVDA fighting for its life trying not to establish confirmation on another bearish trend but price movement will probably continue lower. How much lower remains uncertain but the old support is turning into an established resistance line more and more by the day. If price does a retest and now established a down trend price movement will probably gain enough momentum to move down quite strong. However i will wait and see what price trend the price movement establishes into and then make my position. I would much rather just wait til the bearish trend reverses and buy many shares then for a greater profit margin on my bullish entry then hold a bad short position with uncertain price movements as the NVDA chart right stands as.
NASDAQ:NVDA

NVDA TO $176 BY JUNE THEN $1000 END OF YEARNVDA to $176 by June Then $1000 End of Year: A Bold Thesis
Key Points
It seems likely that NVDA could reach $176 by June 2025, supported by strong AI market trends and upcoming earnings, but reaching $1000 by year-end is highly speculative and controversial.
Research suggests Elliott Wave analysis shows a potential bullish trend, but specific price targets like $1000 lack broad analyst support.
The evidence leans toward significant growth potential due to NVDA's leadership in AI and new product launches, yet such aggressive targets involve high uncertainty.
Current Price and Market Context
As of April 9, 2025, NVDA's closing price on April 8 was $96.30, with pre-market trading at $98.22. This reflects recent volatility, with a 52-week range from $75.61 to $153.13. The stock's performance is tied to its dominance in AI and GPU markets, which are experiencing robust growth.
Analysis for $176 by June
Reaching $176 by June 2025, an 83% increase from $96.30, is ambitious but plausible. Upcoming earnings on May 28, 2025, estimate an EPS of $0.93 and revenue of $43.34 billion, with potential beats driving price surges. Elliott Wave analysis suggests NVDA may be completing a corrective phase, with a falling wedge pattern indicating a possible upward breakout, supporting short-term targets around $176.
Analysis for $1000 by Year-End
The prediction of $1000 by December 2025, a 940% increase, is highly speculative. While some analyses, like a Forbes article, suggest NVDA could see a tenfold rise by 2026 due to the Blackwell architecture, most analyst targets range from $170 to $235. This target lacks broad support and involves significant market and fundamental risks.
Unexpected Detail: Stock Split Impact
An unexpected factor is NVDA's 10-for-1 stock split in June 2024, adjusting prices from over $1,000 to current levels, making historical comparisons complex. This split aligns the $1000 target with post-split valuations, but achieving it requires unprecedented growth.
Survey Note: Detailed Analysis of NVDA's Potential Price Surge to $176 by June and $1000 by Year-End
Introduction
NVIDIA Corporation (NVDA), a leader in graphics processing units (GPUs) and artificial intelligence (AI), is currently trading at approximately $96.30 as of April 9, 2025, based on the closing price from April 8, with pre-market activity showing a slight uptick to $98.22. This analysis explores the feasibility of NVDA reaching $176 by June 2025 and an ambitious $1000 by the end of the year, leveraging Elliott Wave theory and other validated analytical methods. Given the stock's recent performance and market context, we examine technical patterns, fundamental catalysts, and long-term growth potential.
Current Market Position and Historical Context
NVDA's stock has shown volatility, with a 52-week range from $75.61 to $153.13, and a year-to-date change of -11.36% over the past week and -12.23% over the past month, per recent data. The all-time high was $153.13 on January 6, 2025, indicating significant upside potential from current levels. The market capitalization stands at $2.35 trillion, with a beta of 2.40, reflecting high volatility. Key financial metrics include an EBITDA of $83.32 billion and an EBITDA margin of 63.85%, underscoring strong profitability.
A critical context is the 10-for-1 stock split in June 2024, which adjusted share prices from over $1,000 to current levels, making historical comparisons complex. This split, detailed in a CNBC article (Nvidia announces 10-for-1 stock split), was aimed at making ownership more accessible, aligning with the user's post-split price targets of $176 and $1000.
Metric Value
Closing Price (Apr 8) $96.30 USD
Pre-Market Price (Apr 9) $98.22 USD
52-Week Range $75.61 - $153.13 USD
Market Cap $2.35T USD
Beta (1Y) 2.40
Earnings Next Report May 28, 2025, EPS Estimate $0.93, Revenue Estimate $43.34B USD
Last Quarter EPS $0.89 (estimated $0.85, +4.96% surprise)
Dividend Yield (TTM) 0.04%
Elliott Wave Analysis: Technical Insights
Elliott Wave theory, a method identifying market psychology through wave patterns, suggests NVDA may be in a corrective phase, potentially completing wave (4) of a larger five-wave structure. Recent analyses, such as those on TradingView (NVIDIA Stock Chart), indicate a falling wedge or ending diagonal formation, often signaling a reversal and start of an upward trend. This could support a move to $176 by June, as wave (5) projections often extend to 1.618 times wave (1), potentially aligning with such targets.
Specific Elliott Wave analyses, like those from ElliottWave-Forecast (Elliott Wave Expects New All Time High), suggest NVDA has completed corrections and is resuming higher, with wave counts indicating impulsive rallies. However, these analyses lack explicit price targets reaching $1000, focusing more on trend continuations.
Short-Term Target: $176 by June 2025
Reaching $176 by June 2025, an 83% increase from $96.30, is ambitious but supported by several factors. The earnings report on May 28, 2025, is a critical catalyst, with estimates for EPS at $0.93 and revenue at $43.34 billion. Given NVDA's history of beating estimates, as seen in the last quarter with EPS of $0.89 against an estimate of $0.85, a strong report could drive significant price appreciation.
Technical indicators, such as a breakout from the falling wedge, align with this target. Analyst price targets, ranging from $125 to $220 with an average of $177.19 per Zacks (NVIDIA Price Target), also support the possibility, with some forecasts reaching $235.92 (NVDA Forecast). However, achieving this in two months requires sustained bullish momentum and favorable market conditions.
Long-Term Target: $1000 by Year-End 2025
The prediction of $1000 by December 2025, a 940% increase from current levels, is highly speculative. Most analyst forecasts, such as those from MarketBeat (NVIDIA Stock Forecast) and TipRanks (Nvidia Stock Forecast), range from $170 to $235, far below $1000. However, a Forbes article from May 25, 2024 (Nvidia Stock Tops $1,000), suggests NVDA could see a tenfold rise by 2026 due to the Blackwell architecture, potentially supporting a $1000 target by late 2025 if growth accelerates.
Blackwell, a new GPU architecture, is expected to enhance NVDA's AI and data center offerings, potentially driving revenue growth. CoinCodex forecasts a high of $260.32 by December 2025 (NVIDIA Stock Forecast), still below $1000, indicating the target is outlier and involves significant risk. Market volatility, competition, and macroeconomic factors, such as tariff impacts noted in CNN reports (NVDA Stock Quote), add uncertainty.
Fundamental Catalysts and Risks
NVDA's fundamentals are strong, with consistent revenue growth and high EBITDA margins. The company's expansion into AI, autonomous systems, and supercomputers, as noted in LiteFinance (Nvidia Stock Price Prediction), supports long-term growth. However, short-term corrections due to overvaluation or market sentiment, especially around tariff concerns, pose risks.
X posts, such as one from @1000xStocks (X post), highlight NVDA's EPS growth reflecting AI monetization, suggesting bullish sentiment, but lack specific $1000 targets. Another from @ravisRealm (X post) notes adding positions at lower prices, indicating confidence but not supporting the $1000 target.
Conclusion
While reaching $176 by June 2025 is plausible with strong earnings and technical breakouts, the $1000 target by year-end is highly speculative, lacking broad analyst support and requiring unprecedented growth. Investors should monitor earnings reports, product launches like Blackwell, and market trends, while employing risk management strategies given the high uncertainty.

NVIDIA About to TANK? Or Just Cooling Off?After one of the most explosive bull runs in tech history, NVIDIA is showing signs of exhaustion — and this chart’s screaming a massive correction incoming.
🧠 Chart Insights (2W Time Frame):
Current Price: ~$96.30
All-Time High: $152.89
Key Breakdown Levels:
🔵 Pullback Zone: $134.29 — Broken & Completed
🟠 Neckline Support: $90.69
🎯 Major Fibonacci Target: $66.25 (61.8% retracement)
💀 Extreme Support Zone: $10.81 (not likely unless disaster strikes, but chart says what it says...)
🔎 What’s Really Happening:
Bull run started October 2022 and went parabolic into late 2024
Price attempted to consolidate above $130–140 (pullback zone) but failed to hold
Bearish momentum confirmed as we’ve broken through key zones
We’re now headed straight toward the $90s neckline, with $66.25 as a Fibonacci target if trend continues
⚠️ Why This Matters:
This isn’t fear — it’s structure. Nvidia doesn’t have to collapse to zero, but even a healthy correction to $66 would be a 30%+ drawdown from current levels.
That would:
✅ Flush out weak hands
✅ Offer long-term buyers a better setup
✅ Rebalance the overextended rally from 2023–2024
👀 What to Watch:
Retest of $90.69 neckline
Reaction at the 61.8% retracement
Volume spikes on weekly red candles
If bulls don’t step in soon, this is just the beginning of the cooldown
📌 This is not financial advice — just chart surgery.
🔖 Hashtags:
#NVIDIA #NVDA #StockMarketCorrection #BearishStructure #TechStocks #TradingViewCharts #MarketMomentum #PriceAction #FibonacciAnalysis

NVIDIA: Time for a Graphic Comeback?🔍Analysis:
Following up from a previous breakdown, NVIDIA has now tapped into a high-probability Weekly Order Block (OB) just above the sell-side liquidity zone at $88.97. This level also aligns with a structural area of support, making it a prime zone for a potential bullish reversal.
Key signs:
Price is showing early signs of displacement from the OB.
If this zone holds, we could be looking at a 77% move back up to the buyside liquidity at $157.92.
Watch for a strong weekly candle close above $96.30 to confirm the bounce.
🛑 Invalidation:
If price fails to hold this OB and breaks below $88.97, expect a deeper move into the $76.06 zone.
💡 Summary:
Patience is key. We’re sitting on a solid base for a potential bullish push — now it’s all about the confirmation candle. 📊
DYOR — Don't just HODL, study the chart!

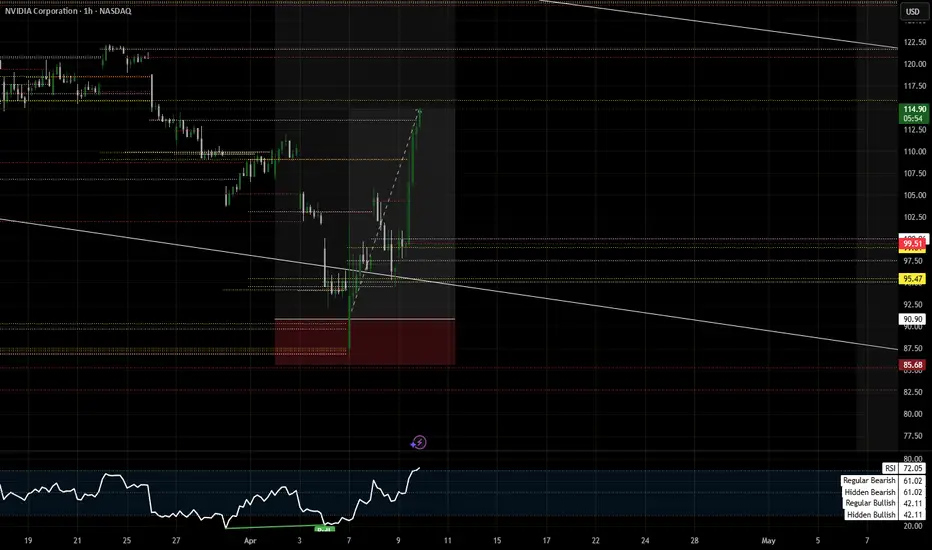
NVDA Technical Analysis – April 9, 2025NVIDIA (NVDA) just got rejected at the top of a falling wedge channel on the 1H chart and is showing clear signs of continued bearish pressure. After testing a key resistance around the $102–$103 zone, price has sharply reversed and is now threatening to revisit lower trendline levels.
Market Structure & SMC Insight:
* NVDA remains in a strong downtrend with price confined in a descending wedge.
* There was no confirmed CHoCH (Change of Character) or BOS (Break of Structure) indicating strength—only a lower high rejection.
* A red resistance zone remains around $103.70, while major support lies around $86.74.
* MACD is curling down after a bearish cross.
* Stoch RSI is pointing lower from the mid-zone, signaling more downside may be ahead.
* Volume has increased on this rejection, giving the move more credibility.
TrendInfo Sentiment Summary:
* MA: Bearish (-2.21%)
* DMI: Bearish (38.33)
* RSI, MACD, Stoch: All showing bearish confirmation.
* DPR (Directional Pressure Ratio): Bearish (43.5%)
* Fear & Greed: Fear (-15.78), overall Sell rating of 75%.
This suggests that short-term traders are risk-off and sentiment is skewed toward more downside.
Options GEX Analysis (Gamma Exposure & Sentiment):
* Current GEX shows strong PUT dominance at 28%, aligning with a bearish directional expectation.
* IV Rank (IVR) at 107.2 with IVx avg at 108.7 indicates high volatility; premiums are rich, great for credit spreads or directional put plays.
* Key Put Support at $90 with heavy GEX clustering below. This is your downside magnet.
* Call resistance sits near $102–$105 range, aligning with the recent rejection. Gamma walls at $108–$111 cap the upside.
Trade Scenarios:
Bearish Scenario:
* Rejection confirmed. If NVDA breaks $94 again, a fast drop to $90 and even $86 support is on the table.
* Put Options with strikes at $90 or debit spreads can work well.
* Watch for continuation volume confirmation.
Bullish Reversal Setup (Low Probability for Now):
* Needs a reclaim of $103.70 with volume.
* A CHoCH + strong bullish candle would trigger potential upside targets of $108 and $111.
* Call debit spreads or long shares only if reversal is confirmed.
My Thoughts: NVDA continues to reflect sector-wide weakness in semis. Without strong market support, the path of least resistance remains down. Given the macro volatility and sentiment tilt toward fear, it's wise to position conservatively and trade with tight risk.
Final Suggestion:
* Put Bias Active
* Avoid heavy call exposure unless reclaim of $103 occurs
* Sell premium if IV stays elevated (e.g. credit spreads)
Disclaimer: This analysis is for educational purposes only and does not constitute financial advice. Always do your own research and manage risk accordingly.

NVDA 4/8/25NVDA showing a rejection at previous support.
Dropped below trend channel and appears to be confirming a rejection there as well
I want it @ $75-80 for sizeable buy.

NVDA UptrendNVDA The rise starts at point 87.50 and continues to rise after exceeding the level of 93
