$TMUS Earnings and Technical AnalysisUndercut and Reverse Pattern Observed in TMUS
On October 23rd, T-Mobile US (TMUS) released its earnings report, surpassing analyst expectations. Despite the positive results, the stock initially experienced a sell-off and closed down approximately 3.3%. The overall downward movement exceeded 5%, wi
Next report date
—
Report period
—
EPS estimate
—
Revenue estimate
—
8.88 EUR
10.95 B EUR
78.63 B EUR
493.69 M
About T-Mobile US, Inc.
Sector
Industry
CEO
Srinivasan Gopalan
Website
Headquarters
Bellevue
Founded
1994
ISIN
US8725901040
FIGI
BBG01K3X40Q5
T-Mobile US, Inc. engages in the provision of wireless communications services under the T-Mobile and MetroPCS brands. It offers postpaid and prepaid wireless voice, messaging and data services, and wholesale wireless services. The company was founded in 1994 and is headquartered in Bellevue, WA.
Related stocks

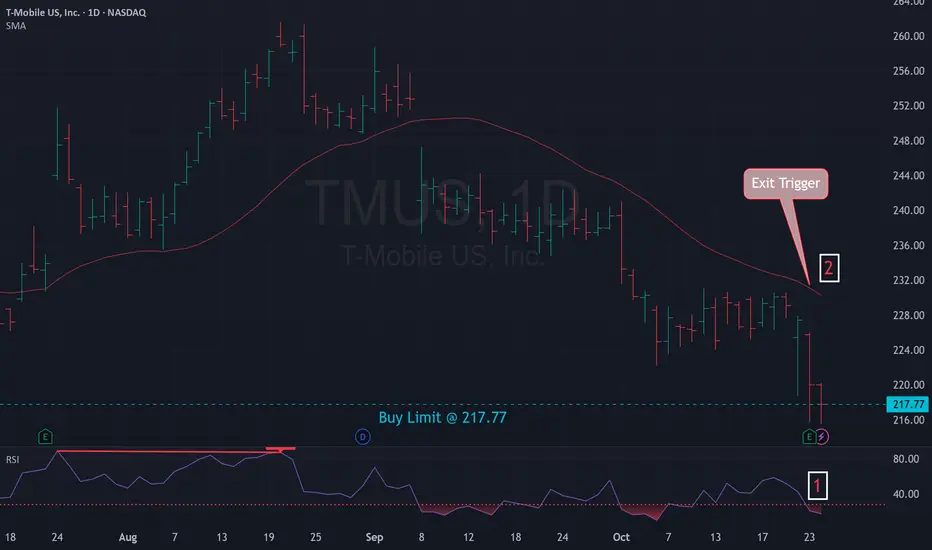
Mean Reversion Setup: TMUS1. RSI in oversold region
2. Price likely to rebound back the the mean
Trade Rules:
Entry Trigger - RSI has cross below oversold region, enter limit buy at close price
Exit Trigger - Close at market when close price cross above exit trigger (Red Line)
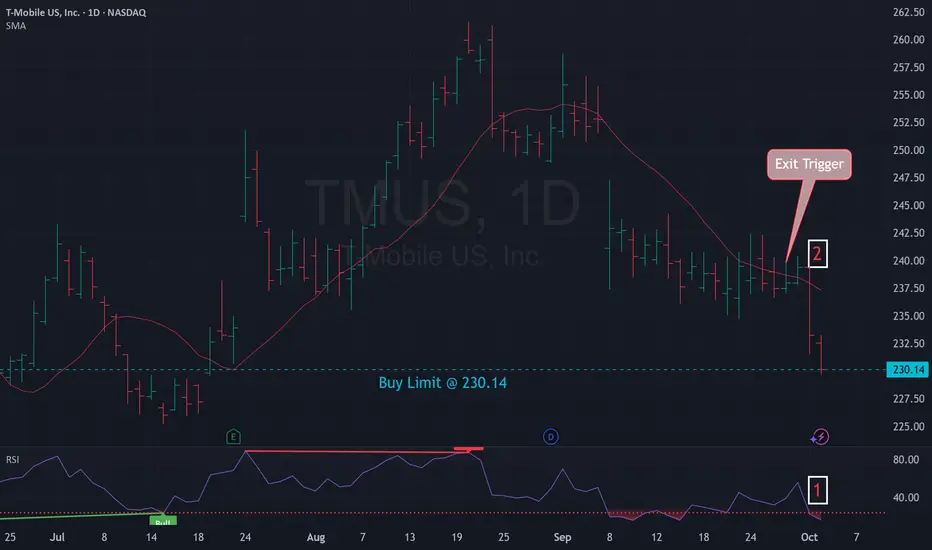
Mean Reversion Setup: TMUS1. RSI in oversold region
2. Price likely to rebound back the the mean
Trade Rules:
Entry Trigger - RSI has cross below oversold region, enter limit buy at close price
Exit Trigger - Close at market when close price cross above exit trigger (Red Line)
T-Mobile: Weak in a Strong Market?T-Mobile USA has limped as the broader market hits new highs, and now some traders may see downside signals emerging.
The first pattern on today’s chart is the gap lower on September 8. (The drop came after SpaceX’s Starlink purchased wireless spectrum licenses with plans to compete against carrier

Mean Reversion Setup: TMUS1. RSI in oversold region
2. Price likely to rebound back the the mean
Trade Rules:
Entry Trigger - RSI has cross below oversold region, enter limit buy at close price
Exit Trigger - Close at market when close price cross above exit trigger (Red Line)

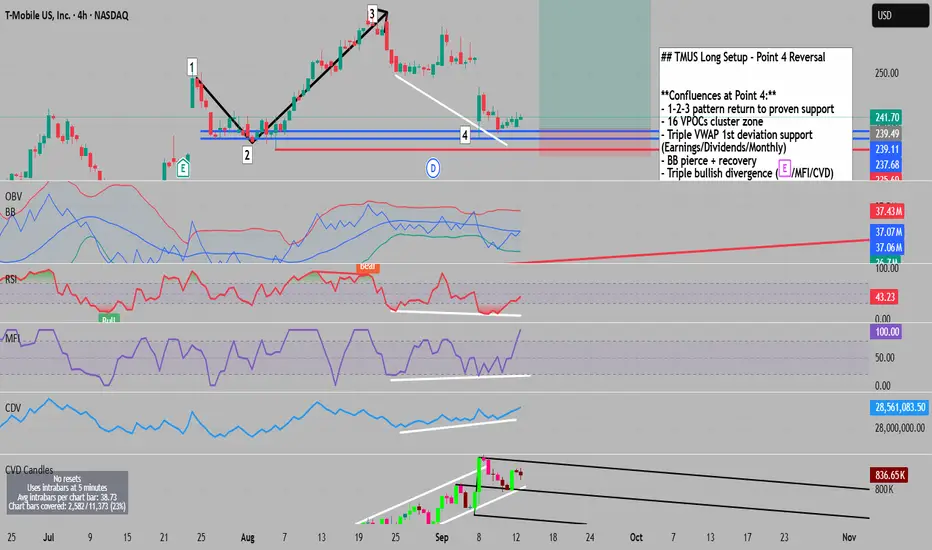
A+ Setup with 5:1 at Key Support```markdown
# 🎯 TMUS: The Perfect Storm - 8 Signals Screaming "BUY" at Critical Support
## **The Setup That Has It All**
When the stars align in trading, you take notice. When EIGHT technical indicators converge at the same price point? You take action.
TMUS just delivered what might be the trade
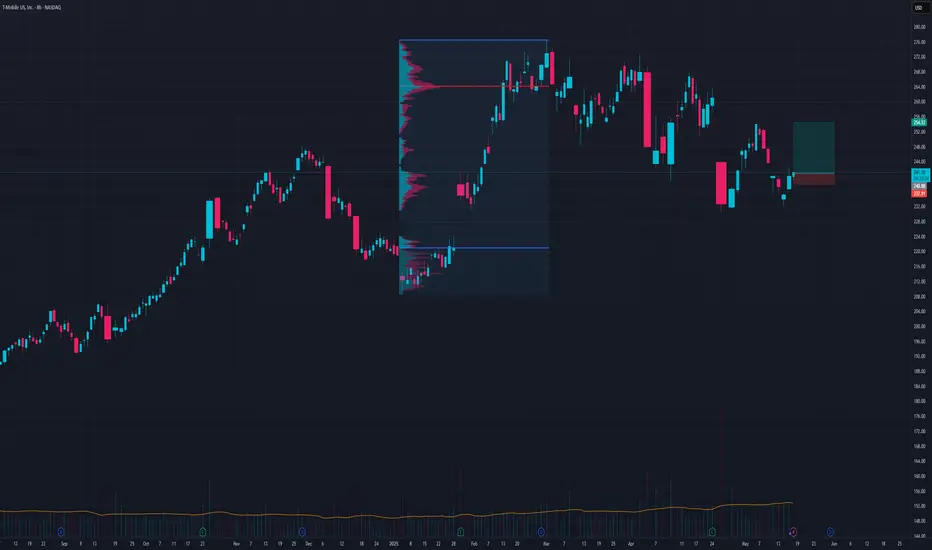
TMUS watch $227.03-227.69: Key support zone to end downtrend? TMUS has dropped a lot from its ATH a few months ago.
Currently testing a key support zone at $227.03-227.69
Look for a clean bounce to signal end of the downtrend.

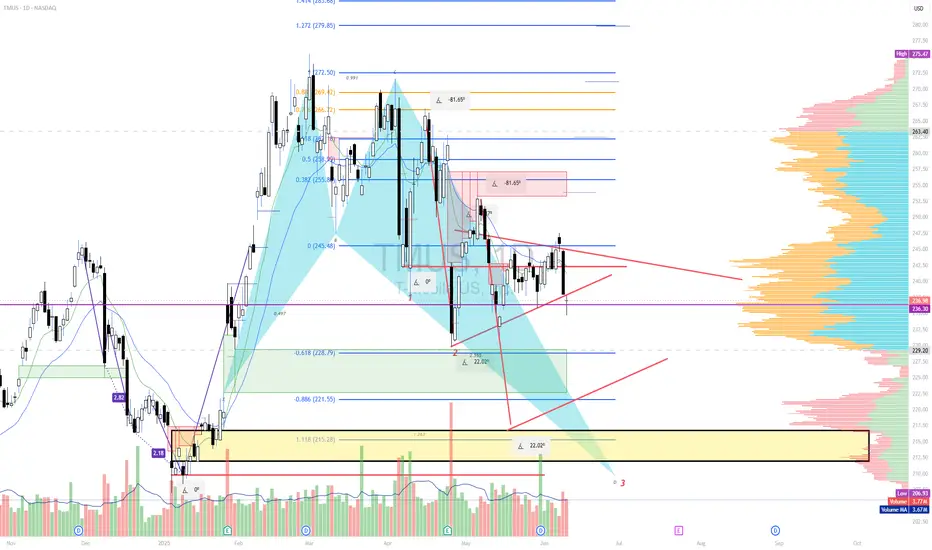
TMUS shortT mobile run seems to been exhausted and setting up. Weekly and Daily setup so anticipate a lot of head spin but on my radar. For now short seems to be my bias. 242.25 shows to be POC before 220 target of max pain. 218-209 is the area of interest for base bullish harmonic.
My View On Longing the $NASDAQ:TMUS NASDAQ:TMUS
always increase the 20% share equity at the best time, when it is cheap.

TMUS Long HereContinuation here into POC
Great risk to reward with this stop loss
SL 238
TP1 254
TP2 262
See all ideas
Summarizing what the indicators are suggesting.
Neutral
SellBuy
Strong sellStrong buy
Strong sellSellNeutralBuyStrong buy
Neutral
SellBuy
Strong sellStrong buy
Strong sellSellNeutralBuyStrong buy
Neutral
SellBuy
Strong sellStrong buy
Strong sellSellNeutralBuyStrong buy
An aggregate view of professional's ratings.
Neutral
SellBuy
Strong sellStrong buy
Strong sellSellNeutralBuyStrong buy
Neutral
SellBuy
Strong sellStrong buy
Strong sellSellNeutralBuyStrong buy
Neutral
SellBuy
Strong sellStrong buy
Strong sellSellNeutralBuyStrong buy
Displays a symbol's price movements over previous years to identify recurring trends.
TMUS5650474
T-Mobile USA, Inc. 6.0% 15-JUN-2054Yield to maturity
5.83%
Maturity date
Jun 15, 2054
TMUS6037451
T-Mobile USA, Inc. 5.875% 15-NOV-2055Yield to maturity
5.83%
Maturity date
Nov 15, 2055
TMUS5475070
T-Mobile USA, Inc. 5.65% 15-JAN-2053Yield to maturity
5.82%
Maturity date
Jan 15, 2053
TMUS5584909
T-Mobile USA, Inc. 5.75% 15-JAN-2054Yield to maturity
5.81%
Maturity date
Jan 15, 2054
TMUS5731959
T-Mobile USA, Inc. 5.5% 15-JAN-2055Yield to maturity
5.81%
Maturity date
Jan 15, 2055
TMUS6197961
T-Mobile USA, Inc. 5.7% 15-JAN-2056Yield to maturity
5.80%
Maturity date
Jan 15, 2056
TMUS5194656
T-Mobile USA, Inc. 3.6% 15-NOV-2060Yield to maturity
5.80%
Maturity date
Nov 15, 2060
TMUS5475071
T-Mobile USA, Inc. 5.8% 15-SEP-2062Yield to maturity
5.80%
Maturity date
Sep 15, 2062
TMUS5900487
T-Mobile USA, Inc. 5.25% 15-JUN-2055Yield to maturity
5.78%
Maturity date
Jun 15, 2055
TMUS4973557
T-Mobile USA, Inc. 4.5% 15-APR-2050Yield to maturity
5.77%
Maturity date
Apr 15, 2050
TMUS5435679
T-Mobile USA, Inc. 3.4% 15-OCT-2052Yield to maturity
5.76%
Maturity date
Oct 15, 2052
See all 1TMUS bonds
Curated watchlists where 1TMUS is featured.


Frequently Asked Questions
The current price of 1TMUS is 178.64 EUR — it has increased by 1.66% in the past 24 hours. Watch T-Mobile US, Inc. stock price performance more closely on the chart.
Depending on the exchange, the stock ticker may vary. For instance, on MIL exchange T-Mobile US, Inc. stocks are traded under the ticker 1TMUS.
1TMUS stock has fallen by −1.91% compared to the previous week, the month change is a −8.72% fall, over the last year T-Mobile US, Inc. has showed a −16.52% decrease.
We've gathered analysts' opinions on T-Mobile US, Inc. future price: according to them, 1TMUS price has a max estimate of 259.39 EUR and a min estimate of 172.93 EUR. Watch 1TMUS chart and read a more detailed T-Mobile US, Inc. stock forecast: see what analysts think of T-Mobile US, Inc. and suggest that you do with its stocks.
1TMUS reached its all-time high on Mar 3, 2025 with the price of 261.86 EUR, and its all-time low was 136.26 EUR and was reached on Nov 30, 2023. View more price dynamics on 1TMUS chart.
See other stocks reaching their highest and lowest prices.
See other stocks reaching their highest and lowest prices.
1TMUS stock is 1.63% volatile and has beta coefficient of 0.54. Track T-Mobile US, Inc. stock price on the chart and check out the list of the most volatile stocks — is T-Mobile US, Inc. there?
Today T-Mobile US, Inc. has the market capitalization of 200.19 B, it has decreased by −3.93% over the last week.
Yes, you can track T-Mobile US, Inc. financials in yearly and quarterly reports right on TradingView.
T-Mobile US, Inc. is going to release the next earnings report on Feb 4, 2026. Keep track of upcoming events with our Earnings Calendar.
1TMUS earnings for the last quarter are 2.05 EUR per share, whereas the estimation was 2.05 EUR resulting in a 0.30% surprise. The estimated earnings for the next quarter are 1.83 EUR per share. See more details about T-Mobile US, Inc. earnings.
T-Mobile US, Inc. revenue for the last quarter amounts to 18.71 B EUR, despite the estimated figure of 18.67 B EUR. In the next quarter, revenue is expected to reach 20.90 B EUR.
1TMUS net income for the last quarter is 2.31 B EUR, while the quarter before that showed 2.74 B EUR of net income which accounts for −15.44% change. Track more T-Mobile US, Inc. financial stats to get the full picture.
Yes, 1TMUS dividends are paid quarterly. The last dividend per share was 0.75 EUR. As of today, Dividend Yield (TTM)% is 1.70%. Tracking T-Mobile US, Inc. dividends might help you take more informed decisions.
T-Mobile US, Inc. dividend yield was 1.28% in 2024, and payout ratio reached 29.28%. The year before the numbers were 0.41% and 9.38% correspondingly. See high-dividend stocks and find more opportunities for your portfolio.
As of Nov 10, 2025, the company has 70 K employees. See our rating of the largest employees — is T-Mobile US, Inc. on this list?
EBITDA measures a company's operating performance, its growth signifies an improvement in the efficiency of a company. T-Mobile US, Inc. EBITDA is 27.56 B EUR, and current EBITDA margin is 37.96%. See more stats in T-Mobile US, Inc. financial statements.
Like other stocks, 1TMUS shares are traded on stock exchanges, e.g. Nasdaq, Nyse, Euronext, and the easiest way to buy them is through an online stock broker. To do this, you need to open an account and follow a broker's procedures, then start trading. You can trade T-Mobile US, Inc. stock right from TradingView charts — choose your broker and connect to your account.
Investing in stocks requires a comprehensive research: you should carefully study all the available data, e.g. company's financials, related news, and its technical analysis. So T-Mobile US, Inc. technincal analysis shows the sell today, and its 1 week rating is sell. Since market conditions are prone to changes, it's worth looking a bit further into the future — according to the 1 month rating T-Mobile US, Inc. stock shows the strong sell signal. See more of T-Mobile US, Inc. technicals for a more comprehensive analysis.
If you're still not sure, try looking for inspiration in our curated watchlists.
If you're still not sure, try looking for inspiration in our curated watchlists.