#TSLA Analysis, Elon breaks the Key level ^.^^Elon pours Big Money $$$ into TSLA stock recently causing Rally!
Price has gone up significantly, I don't think it will drop below $400 any time soon.
Strong Greenbar breaks out from the wedge with large volume increases.
Short sellers are getting squeeze out.
More investors are coming to catch smokey train.
Price Target next $480.
Come and join the Rally.
Trade ideas
$TSLA: Gravity Reasserts ItselfGreetings, traders.
The NASDAQ:TSLA chart is currently painting a picture of a profound test of market physics. This isn't a "battle"; it's a conflict of impersonal forces.
On one side, we have "Lift"—the powerful, almost unnatural force of a narrative focused on AI, robotics, and a limitless future. This force defies traditional valuation and pushes the price to high altitudes.
On the other, we have "Gravity"—the undeniable, constant pull of fundamental reality, which just made itself known in the Q3 earnings report.
The chart is our laboratory, and we are here to observe these forces at work.
The Technical Landscape
The Macro View: The weekly chart shows the narrative's 'Lift' failing at a critical altitude. The price has been decisively rejected from the " gravitational ceiling " of its multi-year ascending channel (approx. $480-$500). This is a level where the weight of reality has consistently proven too strong. The most recent large, bearish candle is not an attack; it is simply the pull of gravity reasserting its dominance over upward momentum.
The Tactical View: The daily chart shows why this 'Lift' is failing. We saw a classic bearish MACD divergence on the final push to the highs—price floated higher, but the underlying force (momentum) was fading. The MACD has now crossed bearishly, confirming the shift. Price is now coiled in a tight daily wedge, a tactical "decision point" where we will see if 'Lift' can be re-established or if 'Gravity' will take full control.
The Philosophy: A Tale of Two Forces
To understand NASDAQ:TSLA $, you must understand the two opposing forces that define its physics.
The 'Lift' (The Narrative Camp): The bull case is a qualitative vision. It's about Robotaxis, Optimus, and AI. This crowd is rightfully unconcerned with a single quarter's auto margins because, in their view, they are buying a different company—one that exists 10 years in the future. Their conviction is deep and provides a powerful upward force.
The 'Gravity' (The Quantitative Camp): The bear case is a spreadsheet. It's about the "now." The Q3 earnings report is the catalyst for this "counter-force."
EPS Miss ($0.50$ vs $0.53$) Severe margin compression from aggressive price cuts. A fundamentals-based valuation (e.g., Morningstar's $250 FVE) that is miles away from the current price.
This setup is a clear piece of the puzzle.
It shows what happens when the powerful force of 'Lift' (Narrative) reaches its apex and meets the immovable, constant pull of 'Gravity' (Macro Supply + Fundamental Reality). At this specific junction, 'Gravity' is in control.
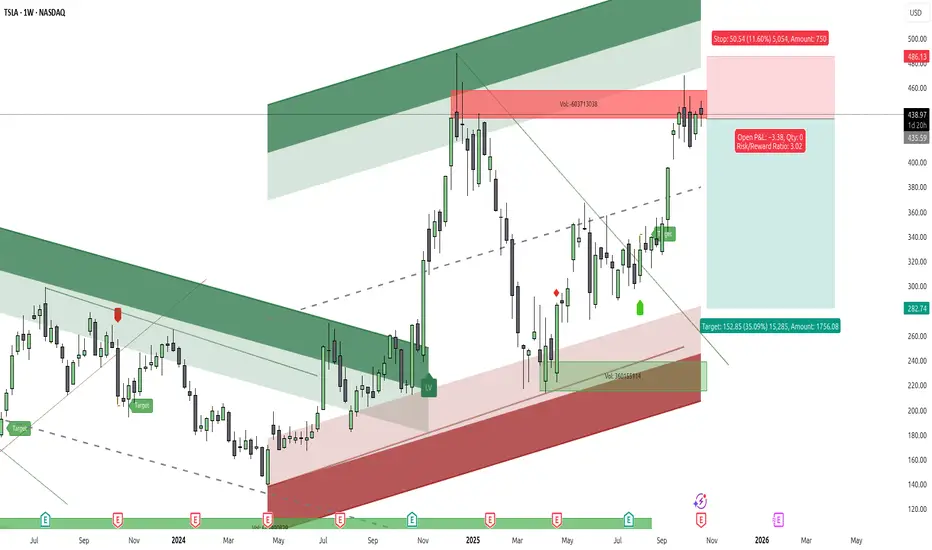
An Illustrative Setup
We do not predict; we observe and we react.
The confluence of a failing 'Lift' at a 'gravitational ceiling,' combined with the new "weight" of a fundamental catalyst, provides a high-probability, asymmetric setup. This is not about being "right"; it is about defining risk.The chart illustrates a potential short setup based on this confluence:
Entry: ~ $435.00$ (Sell Short)
Stop-Loss: ~ $486.00$
Target: ~$282.00$
Risk-to-Reward Ratio: ~3
The confirmation for this thesis would be a breakdown from the daily wedge (around $430), signaling that 'Gravity' has taken firm hold.The stop-loss at $486$ is the "escape velocity" point. If the price breaks above it, the 'Lift' force has overcome 'Gravity,' the thesis is invalidated, and we step aside.
One cannot argue with the market's physics.
Respect the level; it is your anchor to reality.
Disclaimer: This is not financial advice. It is for educational and informational purposes only. Please conduct your own research and manage your risk accordingly.
TESLA Sellers In Panic! BUY!
My dear subscribers,
My technical analysis for TESLA is below:
The price is coiling around a solid key level - 429.39
Bias - Bullish
Technical Indicators: Pivot Points Low anticipates a potential price reversal.
Super trend shows a clear buy, giving a perfect indicators' convergence.
Goal - 446.44
About Used Indicators:
By the very nature of the supertrend indicator, it offers firm support and resistance levels for traders to enter and exit trades. Additionally, it also provides signals for setting stop losses
Disclosure: I am part of Trade Nation's Influencer program and receive a monthly fee for using their TradingView charts in my analysis.
———————————
WISH YOU ALL LUCK

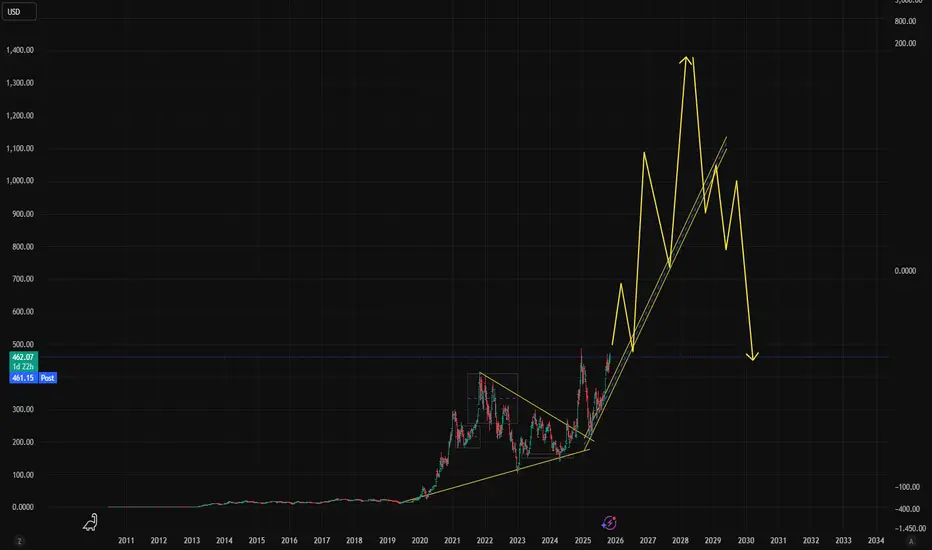
$TSLAHi we are back again with another banger: NASDAQ:TSLA
This is not financial advice but it is very much just key insight.
Here we have NASDAQ:TSLA trading at $462.07 with a potential %, which can bring 100%+ in profits.
Elon musk is doing great things for humanity, and TSLA is going to be a pillar of earths future success. With saying that we know Elon wont let earth of his NASDAQ:TSLA share holders down.
Possible bull market until the end of 2026 which is where we can start to see a break down in trend which would possibly be above $1000+ per share.
Don't forget to use your NASDAQ:TSLA shares to vote today :)
Thank You Elon Musk for everything !!
Don't forget to Comment Like & Share with a friend for good luck, peace out !!
$TSLA: in a trading rangeNASDAQ:TSLA seems to be in a trading range to complete wave (4) of 3, and wave 4. Buying at the range low ($420-$430) and selling $450, $460 call options is my TSLA strategy for now for short term shares. I also have uncovered long term shares.

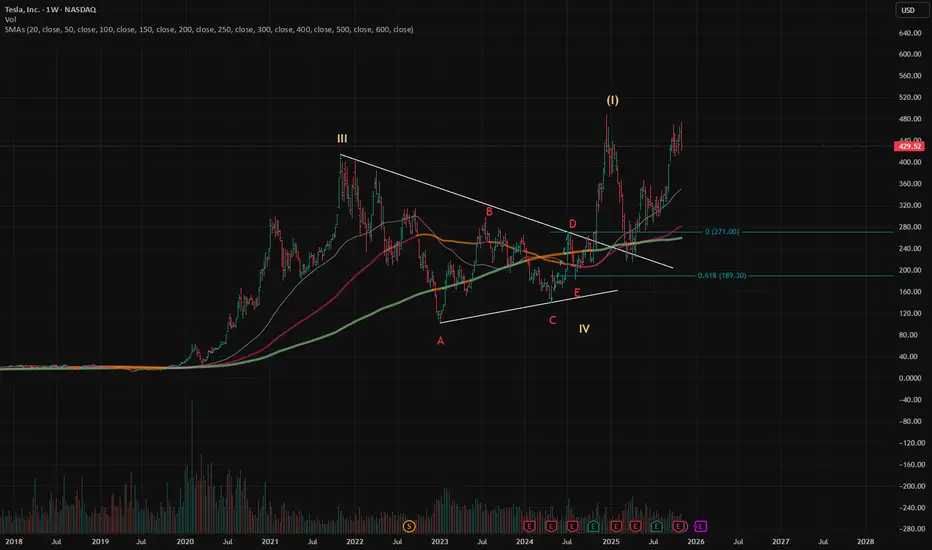
$TSLA: Weekly BullishNASDAQ:TSLA Weekly: I consider TSLA to have completed Wave III. Triangles are more likely to appear in Wave IV. We are in an extending Wave V.
Wave (I) of V has completed. Wave (II) appears to be a very sharp zigzag.
Tsla weekly chartI think it's time to sell tsla
We got a bad signal down trend candlestick & down trend RSI
GOOD LUCK 4ALL

Tesla - Stay patient and don’t rush in 🔮 Tesla (TSLA) – Long-Term Weekly Outlook
Based on the weekly timeframe, Tesla has completed its historical bullish cycle, topping out at $488.54, and has since entered a major corrective phase that has lasted for nearly two years.
This structural correction now appears to be in its final stages, as the price consolidates within what looks like a clear institutional accumulation zone.
---
⚙️ Key Technical Zones
The 2020 Point of Control (POC) around $219.42 represents the core price level that supported Tesla’s previous major rally.
The long-term ascending trendline passes right through this area, reinforcing it as a major structural support.
Just below lies the $183–$185 region, which marks a powerful confluence zone of:
Fibonacci 0.786 retracement,
a historical VWAP level near $183.60, and
the beginning of a strong volume node on the profile.
> This region is what institutions often refer to as the “final accumulation zone” — where large investors quietly rebuild positions before the next expansion phase begins.
---
📉 Expected Scenario Before the Next Rally
During the first quarter of 2026, Tesla is expected to experience one last corrective leg, gradually pulling back toward the $185 level, which aligns perfectly with the 0.786 Fibonacci retracement.
This move will likely act as a liquidity sweep — shaking out late buyers and triggering stop-losses — before institutions start accumulating heavily again.
---
💰 Smart Buying Zone
Optimal entry range: $183 – $190
Entry confirmation: A strong bullish weekly candle with rising volume emerging from the support zone
Protective stop: Weekly close below $170
Projected upside targets:
1. $295
2. $340
3. $396
4. $475
5. $520
These represent the key stages of Tesla’s expected bullish recovery cycle for 2026–2027.
---
🧠 Institutional Perspective
Large funds (“the whales”) are patiently waiting for this final phase of the correction to rebuild their long-term positions at discounted prices.
Between March and May 2026, the accumulation process is expected to complete, marking the beginning of Tesla’s next major bull cycle.
---
✅ Summary
The final downside scenario projects a move to around $185,
right at the 0.786 Fibonacci level — the last golden buying zone before the next historical rally begins.
⏳ Recommendation:
> Stay patient and don’t rush in — the real buying opportunity will come with the whales 🐳
in the $183–$185 zone, where smart money quietly re-enters the market.

Tesla faces critical resistance near $435 – traders eye key leveCurrent Price: $429.52
Direction: SHORT
Confidence Level: 60%
Targets:
- T1 = $414.62
- T2 = $396.69
Stop Levels:
- S1 = $439.99
- S2 = $445.00
**Wisdom of Professional Traders:**
This analysis synthesizes insights from multiple professional traders, providing a clear picture of Tesla’s price action and technical setup. The wisdom of the trading community has highlighted key resistance at $435 and broader concerns of bearish momentum driven by recent price patterns and fundamental signals. While no clear bullish sentiment has emerged, the majority of snippets suggest downside risks if Tesla fails to reclaim critical levels, with a focus on aggressive short-term trading opportunities this week.
**Key Insights:**
Tesla is currently under pressure, as highlighted by many professional traders referring to breakdowns from key technical levels. The invalidation of a bullish cup-and-handle pattern after Tesla's close below $439.99 this week signals further bearish sentiment in the stock market. In addition, traders have repeatedly commented on the recent failure to hold above the 50-day moving average, which is critical to bolster further upward momentum. Prices over the weekend consolidated between $414 and $445, reflecting Tesla’s rangebound yet volatile price action.
Many traders also noted the potential for Tesla to test lower bound support levels, including the key zone between $396 and $401. Furthermore, the approval of Elon Musk’s $1 trillion incentive pay package has created mixed views about the near-term outlook, with the news interpreted as overambitious in its goals related to autonomous technology. This has led to increasing skepticism over Tesla shares sustaining high valuations in the face of volatility across technology stocks.
**Recent Performance:**
Tesla’s stock saw a 3.68% decline last Friday, closing at $429.52 compared to $445.91 earlier in the week. The broader tech sector exhibited weakness, with key indices such as NASDAQ experiencing one of its worst weeks of 2023 due to sell-offs across top technology names. Comparisons to other tech giants like Meta (-17.4%) and Nvidia (-7%) highlight Tesla’s relative weakness, while broader concerns tied to valuation adjustments and profit-taking have weighed heavily on tech leadership trading.
Tesla’s recent rejection at $439-$440 has reinforced bearish signals, with many traders eyeing prices retesting the $414-$420 zone. Signs of rangebound movement between $410 and $470 were referenced, but consistent failure to move above $445 suggests bearish control this week.
**Expert Analysis:**
Several professional traders highlighted Tesla’s inability to reclaim the pivot level of $439.99. This invalidated a cup-and-handle formation, confirming bearish momentum. Tesla’s near-term outlook points to a settlement below $414.62 as a potential catalyst for accelerated downside to test $396-$400 levels. Traders also noted Tesla has historically bounced near $420 as part of a consolidation range – though failing to hold this level could open up considerable downside.
Specific technical indicators such as the MACD histogram, RSI, and stochastic oscillator further confirm bearish setups, with no immediate signs of reversal. Traders are also watching for critical support levels around the 50-day moving average, where failure to stabilize could unlock sharper declines toward the mid-$380 zone.
**News Impact:**
Tesla’s approval of a $1 trillion pay package for Elon Musk has amplified bearish sentiment as traders assess high-risk growth metrics tied to emerging technologies like humanoid robots and robo-taxis. While the long-term implications for Tesla’s EV dominance are unclear, recent sales declines in Germany and Scandinavian markets have raised concerns about pressures on revenue and valuation sustainability.
Broader macroeconomic volatility, compounded by sector-wide risks in technology, also weighs heavily on Tesla. Market sentiment has leaned negative as fear and greed indices reflect heightened caution among investors. These factors further reduce Tesla’s chances of breaking bullish through near-term resistance levels like $439-$445, leaving the stock vulnerable to further decline.
**Trading Recommendation:**
Looking at Tesla’s technical setup and broader sentiment, I recommend a SHORT position this week with price targets at $414.62 and $396.69. A decisive failure to hold above $439.99 confirms bearish continuation, while stops set near $445 provide logical risk management against unexpected rebounds. With mixed signals across trading analyses but consistent downside references, this setup favors traders focused on managing short-term volatility.
Do you want to save hours every week? register for the free daily update in your language!

Tesla / Palantir Fractal STILL playing out STRANGELY ACCURATEMillions of people
...buying Trillions of dollars of assets
...at random times
...on random days
but somehow these 2 assets move together on the x-axis & the y-axis??
Cansomeone explain this to me mathematically?
May the Truth be with you.

C&H on TESLABuy and hold, strong move towards 700-800 USD
CUP and HANDLE PATTERN USUALLY HAS HIGHEST PROBABILTY TO BREAK UPSIDE

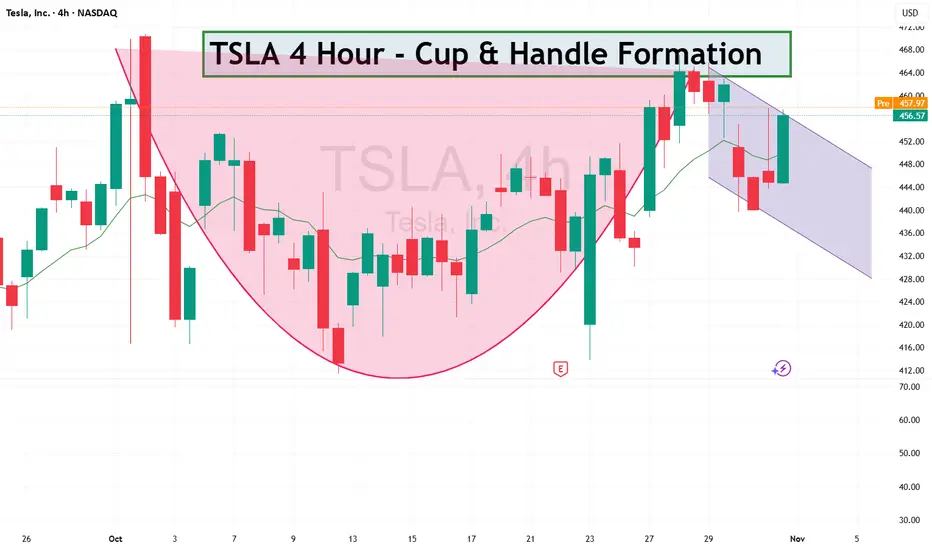
TALS - Cup and Handle FormationTSLA looks quite bullish, as you can see cup and handle formtion on 4 hour.
#TSLA #Tesla #Stocks #Trading #StockMarket #TechnicalAnalysis
TSLA shorts may get toastedA rising trendline acting as strong dynamic support from the August lows.
Resistance zone near $470–475 (yellow line, recent double-top area).
Current price at $456, holding above trendline support.
Support floor near $290, far below current levels — indicating we’re in a mid-term uptrend phase, not deep correction.
This pattern fits a rising channel consolidation near resistance — the next move depends on whether the trendline holds.
📈 Bullish Scenario
Setup:
TSLA is holding the ascending trendline while consolidating just below resistance — a classic bullish continuation structure.
Confirmation Triggers:
Break and daily close above $470–475 (clear breakout).
Follow-through volume or a strong gap-up session confirming momentum.
Short-Term Targets:
$490–495 → initial breakout target (projected move from last swing).
$510–520 → extended target if buyers sustain momentum.
Catalysts:
Broader tech strength (QQQ, NASDAQ rally).
Positive EV demand data or production updates.
Institutional accumulation at the breakout level.
Invalidation:
Break and close below $445, violating trendline support.
Probability: ~60% (uptrend intact, momentum favors bulls).
📉 Bearish Scenario
Setup:
If TSLA fails to break $470 again and loses the $445 trendline, momentum could unwind toward prior support.
Confirmation Triggers:
Close below $445 with increased volume.
Failed retest near $450–455 forming lower high.
Short-Term Targets:
$420–425 → first support zone from early October.
$390–400 → deeper correction toward base of last breakout.
Catalysts:
Weak market sentiment or NASDAQ pullback.
Negative headlines on delivery numbers or margins.
Broader EV sector weakness.
Invalidation:
Breakout above $475 with strong follow-through.
Probability: ~40% (depends on strength of support at $445).
⚖️ Neutral / Sideways
If TSLA oscillates between $445–475, expect continued range consolidation along the trendline — typically preceding a directional breakout in 1–2 weeks.
🧩 Summary Table
Bias Confirmation Target Zone Invalidation Notes
Bullish Close > $475 $490 → $520 < $445 Continuation of uptrend
Bearish Close < $445 $425 → $400 > $475 Trendline break
Neutral Range $445–475 — — Coiling near apex
🕒 2–3 Week Projection
Bullish path: Hold $450–455 → breakout above $475 → reach $495–500 by mid-Nov.
Bearish path: Reject $470 → break below $445 → pull back to $420 by late Nov.

Tesla Wave Analysis – 30 October 2025
- Tesla reversed from the key resistance level 467.30
- Likely to fall to support level 415.60
Tesla recently reversed from the resistance area between the key resistance level 467.30 (which stopped the previous impulse wave I at the start of October) and the resistance trendline of the daily up channel from April.
The downward reversal from this resistance level 467.30 is likely to for the daily Japanese candlesticks reversal pattern Evening Star Doji – strong sell signal for Tesla.
Given the strength of the resistance level 467.30 and the overbought daily Stochastic, Tesla can be expected to fall toward the next support level 415.60 (low of waves ii, c and a).

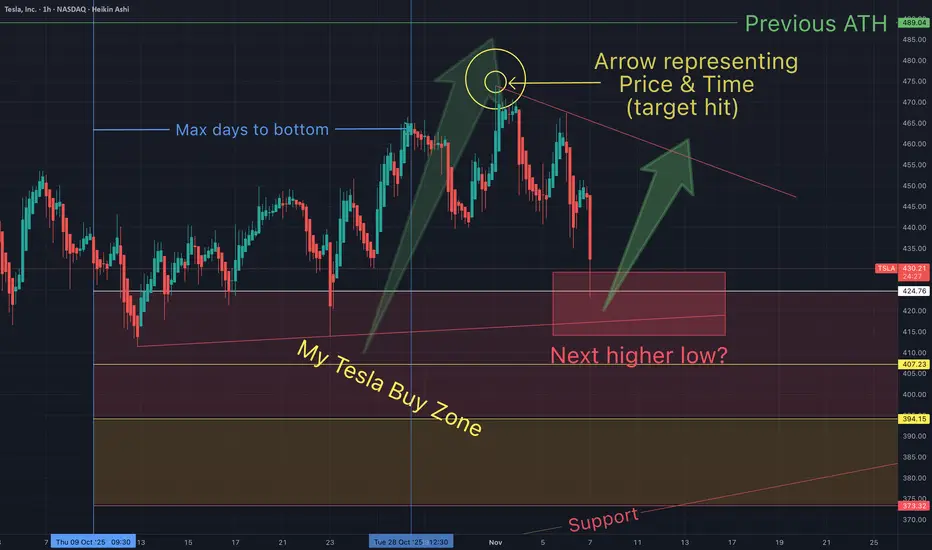
My Last Tesla post before ALL TIME HIGHOn Oct 21st I said I was adding to my positions (price at the time below):
Some of my target hit. We may even go lower.
What do you think?
TSLA 3-Drive & ABCD Pattern – Path to $500 Before a PullbackThis chart highlights multiple harmonic and Elliott structures aligning for a potential bullish extension in Tesla (TSLA). A well-defined ABCD pattern and 3-Drive pattern suggest momentum building toward the $500 zone, supported by Fibonacci projections and channel resistance.
The current wave structure points to an imminent 5-wave advance, likely completing the “Drive 3” and pattern D confluence area near $500–505. Following that move, a corrective pullback (ABC) is anticipated, possibly retesting prior support near $440–400.
Key elements featured:
ABCD completion zone: around $500
3-Drive pattern: confirming exhaustion at upper trendline
Elliott 5-wave projection: short-term bullish continuation
Possible corrective phase: after the final wave up
📈 Watching for confirmation of Wave iii and potential exhaustion signals near $500 before considering downside setups.

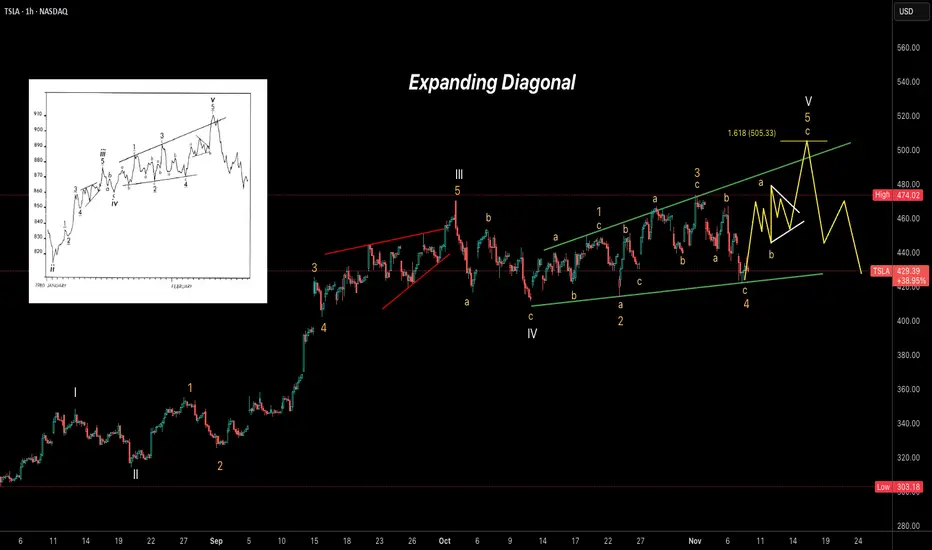
TSLA – Expanding Diagonal in Progress Tesla (TSLA) appears to be forming an Expanding Ending Diagonal pattern on the 1-hour chart, suggesting the final stages of a larger impulsive structure. Wave (V) seems to be unfolding with internal subdivisions visible, possibly targeting the 1.618 Fibonacci extension near 505 before a sharp reversal.
Key observations:
Structure resembles a textbook expanding diagonal (5-3-5-3-5).
Wave 4 found support near the lower trendline.
Wave 5 projection aims toward the 500–505 area.
Expecting a potential pullback or reversal once the diagonal completes.
TSLA: one more leg down potential NASDAQ:TSLA
Watching for one more leg down into the 430–400 mid-term support zone to potentially complete the corrective structure, if price remains unable to break out above the October/November highs.
Chart:
Alternatively, if price manages to break-out and stay above above recent resistance, odds favor continuation to 555-630 resistance zone.
Chart:
Previously:
• On macro bottoming potential (Jun 6):
tradingview.com
• On support (Sep 19):
• On mid-term support (Oct 7):

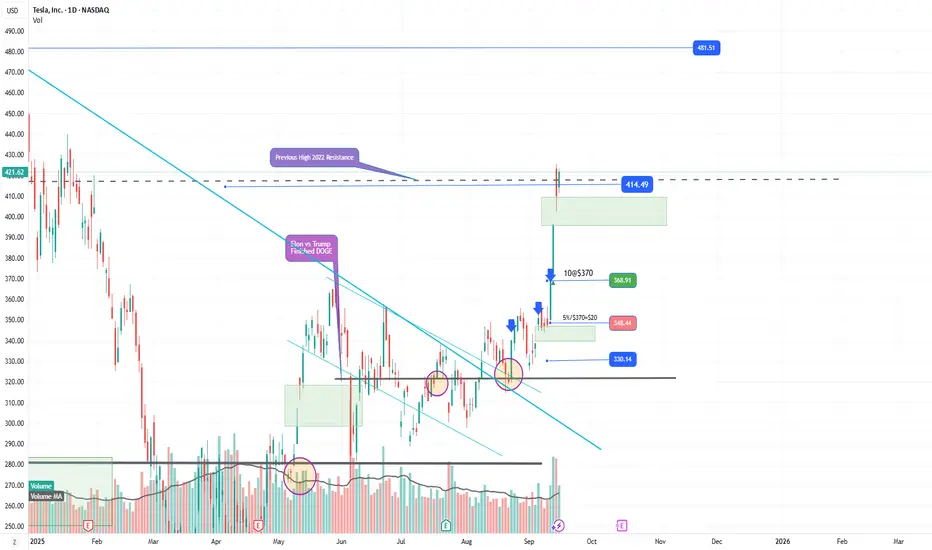
Tesla at a Breakout Crossroad
The Tesla (TSLA) daily chart shows a classic Cup & Handle pattern nearing a critical resistance zone. The key level sits around $450, aligning with a long-term descending trendline (in blue).
Technical Overview:
General Trend:
Since early 2025, TSLA has been in a steady uptrend.
The 50-day moving average (SMA 50) near $220 acts as strong dynamic support and is still trending upward.
The structure indicates Tesla is finishing the “handle” phase of the pattern — a decisive moment is approaching.
Bullish Scenario:
If the price breaks and holds above $450 with strong volume, it would confirm the Cup & Handle breakout.
Potential upside targets:
Short-term target: $503
Mid to long-term target: $565 (based on cup depth projection)
Stop loss: Below $410
A breakout above $450 could trigger a strong continuation rally as investors re-enter on technical confirmation.
Bearish Scenario:
Failure to break above $450 and a drop below $410 could invalidate the bullish setup, leading to a deeper correction.
Potential downside targets:
Short-term target: $375
Long-term target: $320
Stop loss: A confirmed close back above $445
This would suggest that the handle failed, and selling pressure could accelerate toward lower supports.
Timeframe Summary:
Short-term (1–3 weeks):
Expect consolidation between $410–$450, with bias toward a breakout if the tech sector remains strong.
Long-term (3–6 months):
A confirmed breakout above $450 opens the path toward $565.
If rejected, expect a correction toward $375, possibly forming a new accumulation base.

Is Tesla Setting Up for a Rebound? Key Entry Levels Inside🎯 TSLA: The "Thief Strategy" Playbook | Swing/Day Trade Setup 📈
🔥 Quick Overview
Asset: Tesla, Inc. (TSLA)
Bias: 🐂 BULLISH
Strategy Type: Thief Layering Entry Method
Risk Level: Medium-High (Swing/Day Trade)
💰 The "Thief" Entry Strategy Explained
The "Thief Strategy" uses multiple limit orders (layering method) to accumulate position at different price levels. Think of it like setting traps at various floors of a building—you catch opportunities wherever price decides to visit! 🎣
📊 Entry Zones (Layer Your Orders):
Layer 1: $430.00
Layer 2: $435.00
Layer 3: $440.00
💡 You can add more layers based on your own risk appetite and account size. The beauty of layering? You average your entry and reduce timing risk!
🛡️ Stop Loss (SL):
Thief SL: $415.00
⚠️ Important Note: This is MY stop loss level based on the Thief Strategy framework. You're the captain of your own ship! 🚢 Adjust your SL based on YOUR risk tolerance and account management rules. Trade at your own risk—make money, take money, manage wisely!
🎯 Target (TP):
Primary Target: $490.00
🚨 Why $490? This zone represents a confluence of:
Strong resistance area
Potential overbought conditions
Historical trap zone where bulls get exhausted
📢 Thief OG's Reminder: I'm NOT saying you MUST take profit only at my TP level. If you see profits that make you smile, SECURE THEM! 💵 The market gives, and the market takes. Be greedy when you can, be smart always.
🔍 Technical Analysis Breakdown
Tesla is showing bullish momentum structure with potential for continuation toward the $490 resistance zone. The layering strategy allows us to build position as price potentially dips into demand zones before the next leg up.
Key Technical Levels:
Support Zone: $430-$440 (Our entry layers)
Invalidation: Below $415 (Stop loss)
Resistance Target: $490
📌 Related Pairs to Watch (Correlation Play)
Understanding correlated assets helps confirm your thesis:
AMEX:SPY (S&P 500 ETF)
TSLA often moves with broader market sentiment
Watch SPY for overall risk-on/risk-off environment
NASDAQ:QQQ (Nasdaq 100 ETF)
Tech-heavy index where TSLA is a major component
Strong correlation with TSLA price action
NASDAQ:NVDA (NVIDIA)
Both are high-beta tech growth stocks
Often move together during risk appetite shifts
TVC:DXY (US Dollar Index)
Inverse correlation: Strong dollar = pressure on growth stocks like TSLA
Weak dollar = tailwind for equities
💡 Key Point: If SPY/QQQ are bullish + DXY weakening = Strong confirmation for TSLA upside!
⚡ Trading Tips for Thief OG's
Don't FOMO — Let price come to your layers
Manage position size — Each layer should be equal weight
Trail your stop — Once profitable, protect gains
Watch volume — Confirm breakouts with volume spikes
Stay flexible — Market conditions change; so should you!
🎬 Final Words
This setup is all about patience, precision, and profit extraction! 🎯 The Thief Strategy isn't about stealing from the market—it's about being SMART and setting yourself up for success with calculated entries.
Remember: The best trades are the ones where you're prepared, not scared! 😎
✨ If you find value in my analysis, a 👍 and 🚀 boost is much appreciated — it helps me share more setups with the community!
#TSLA #TeslaStock #SwingTrading #DayTrading #ThiefStrategy #LayeringStrategy #StockMarket #TradingIdeas #TechnicalAnalysis #BullishSetup #TradingStrategy #RiskManagement #StockTrading #MarketAnalysis #TradingCommunity

Tesla Consolidates Before Next Bullish BreakoutTesla Consolidates Before Next Bullish Breakout — Eyes on $550, $600, and $650 Targets
Tesla’s price action has formed a series of bullish continuation patterns, each followed by strong upward moves. Currently, the stock is consolidating between $413 and $470, creating a potential accumulation zone before the next breakout.
The repeated triangle breakout patterns suggest a continuation of the bullish trend if Tesla manages to hold above the $413 support level.
Once price breaks above the $470 resistance, Tesla could accelerate toward the next targets at $550, $600, and $650, as indicated on the chart.
In the short term, some sideways movement within the current range is possible before the next strong impulse upward.
You may find more details in the chart!
Thank you and Good Luck!
❤️PS: Please support with a like or comment if you find this analysis useful for your trading day❤️

Tesla Stock: Poised for a MASSIVE CRASH? Buckle Up!🚀 Tesla Stock: Poised for a MASSIVE CRASH? Buckle Up! 📉
🔥 Explosive Technical Breakdown!
On the 4-hour timeframe, Tesla is teetering on the edge! A break below $411.42 screams a BEARISH SETUP! 🚨 But hold up – this only kicks in if the price fails to BLAST through $454.43 resistance.
💥 Bigger Picture? It’s BRUTAL! Tesla just SMASHED a critical support level, paving the way for a VICIOUS DOWNtrend! Bears are circling, and the stage is set for a MELTDOWN! 😈
Will Tesla CRUMBLE or pull a last-second escape? Who’s next to get WRECKED?
🚀 Analysis + LIGHTNING-FAST Signals? Follow NOW! ✅
📊 Want a GOLD Decision-Making Chart? Smash LIKE! ✅
💬 Got Thoughts? Comment – Replying to the BEST! ✅

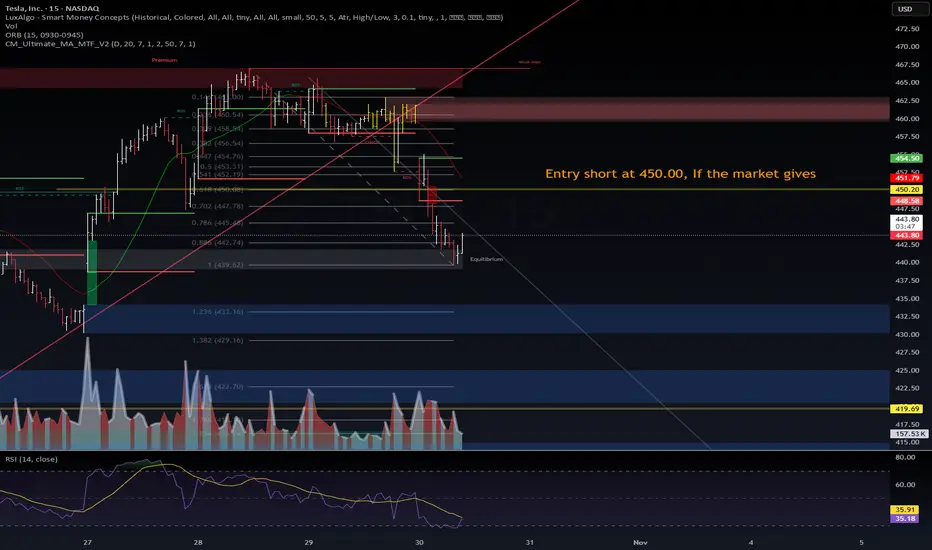
$TSLA | Short Setup Loading — 450 is the Line in the Sand⚙️ NASDAQ:TSLA | Short Setup Loading — 450 is the Line in the Sand
Tesla continues its controlled descent after rejecting the weak high at 465–470.
Price retraced into the 0.786 Fib (≈ 445) zone, finding short-term equilibrium before the next leg.
📊 VolanX DSS Technical Outlook (15m):
Structure confirms bearish displacement with multiple CHoCH breaks.
Retrace zone: 447 → 450 = ideal short re-entry if market allows.
Target zones: 433 → 420 → 419.69 (liquidity shelf).
RSI = 35 → momentum favors continuation; no confirmed divergence yet.
Volume dropping into equilibrium = possible redistribution phase.
🎯 Trade Plan:
Entry short @ 450.00 if market gives.
Maintain stop above 452; scale out near 433–420.
VolanX Liquidity-Reversal-Guard (LRG) stays inactive until RSI divergence appears.
Macro Context (Oct 30 2025):
Fed tone = hawkish → yield = 4.10 %.
Risk assets fading post-earnings; AI and EV names seeing capital rotation.
NASDAQ:TSLA tracking NASDAQ:QQQ correlation ≈ 0.83 → expect synchronized intraday volatility.
VolanX DSS Bias:
🟥 Bear 60 % 🟨 Neutral 25 % 🟩 Bull 15 %
“450 is the battlefield — equilibrium decides who walks away.”
#TSLA #WaverVanir #VolanX #SmartMoney #Liquidity #Macro #Fed #AITrading #SPY #QQQ #Tesla #ShortSetup