TSLAIt is completing wave c of X. After completing the corrective wave, I expect the price to increase.
1TSLA trade ideas

TSLA looking like it may bounce this weekTSLA has a bit more room to leg down. But it is at the bottom of a daily trend channel, which could signal a bounce. However, Elon has been getting punched in the mouth lately so who knows how much further this could tick down. Entry to the upside is annotated in the video.

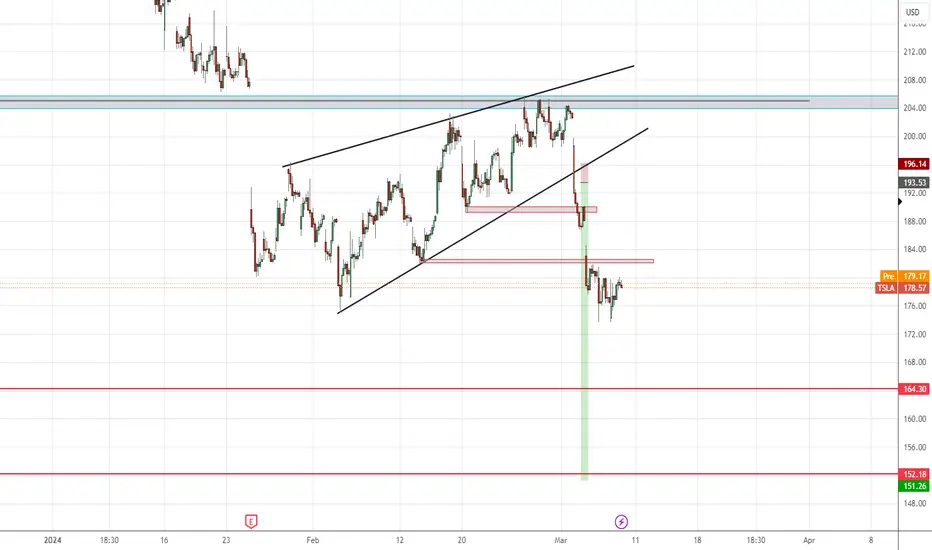
Tesla investment updateOkay so when we have a look at the chart we can see that the price has been dropping for some time now.
At this moment we are in a zone that could be interesting for us to trade/add to our long term investment.
That zone is the block we see in yellow. This zone was resistance in the past and could be going to be support this time. We do have to wait and see what the price does when we are at this zone and see what the volume will do.
If we do see a break below that level we could be going to the other yellow block below the first one but that is something we need to see and wait for.
We also see that we have a descending wedge. This is not a good sign that because for some good movement to the top we need to break that wedge aswel. And we can see in the past that it already did have some trouble with breaking this zone.
We also see on the chart that we have a ascending wedge that was valid already. We have a break of the wedge and then we saw a retest of that wedge and then we went all the way down. This is the price and zone that we are in now.
So if we want to keep this stock we need to see a break of the ascending wedge and a break of the descending wedge and a respect of the yellow zone.
So we have 3 things that we need to see before we can see a big pump again.
We also do have to mention that this is just only a technical analysis and that with companies like this we also need to have a look for the fundamental data and we need to see what the price is going to do when we have earnings reports.

TESLA: Long Trade Explained
TESLA
- Classic bullish setup
- Our team expects bullish continuation
SUGGESTED TRADE:
Swing Trade
Long TESLA
Entry Point - 175.34
Stop Loss - 168.70
Take Profit - 191.02
Our Risk - 1%
Start protection of your profits from lower levels
❤️ Please, support our work with like & comment! ❤️

TSLA WEEKLY CHART Question, Do buyers come in at his level? I personally don't know if they will but this will be something I'm watching this week.

Tesla My view on Tesla on the weekly time frame, it my retest the fibs levels at the FVG or it can still drop towards the imbalance

TSLA shortTSLA is overvalued compared to other car companies
short term bearish, with RSI trending below 50 and price drop and a swing low on the weekly. would touch this stock for another year or so I think

TSLA to NIO market cap comparisonOn a down market day I decided to look at the comparision of market cap between TSLA and NIO by a share price ratio basis. On the daily chart, albeit with fluctuations, TSLA is continuously gaining market cap compared with NIO. This ratio allows for a tool to help decide whether to buy TSLA or NIO.
In short, TSLA is a buy at the low pivots of the ratio, while NIO is the buy at the high pivots which is right now.
Conversely, TSLA is a sell or short at the high pivots while NIO is a sell at the low pivots.
The trade right now is sell TSLA to decrease the position and use the proceeds to buy
NIO either in bulk or in increments to average in.

Trying TSLA againidk if it was the company buy in program or what but i def missed a $25 downside move on tsla. kinda salty about that ngl. from the looks of it we're setting up for a leg back up to 200-210.
gonna start looking at contracts couple months out once we find a clear bottom.

TESLA What Next? BUY!
My dear friends,
Please, find my technical outlook for TESLA below:
The price is coiling around a solid key level - 175.34
Bias - Bullish
Technical Indicators: Pivot Points High anticipates a potential price reversal.
Super trend shows a clear buy, giving a perfect indicators' convergence.
Goal - 195.09
Safe Stop Loss - 165.33
About Used Indicators:
The pivot point itself is simply the average of the high, low and closing prices from the previous trading day.
———————————
WISH YOU ALL LUCK

TESLA: Last analysis correct, time is getting stretched Last analysis was correct: we have had a top and after 40 out of 44 days a considerable retracement to begin a T+2i.
We expect more downtrend for next week, at least we should go lower than 173.70. The t+3 has still another day but eventually we can extend time through an Hybrid cycle.
This mean that time is stretched to proceed with a downtrend.

Short TSLAThe overall picture is sideway down.
TF Month
- Bear Signal
TF Week
- Close to the turning point

TSLA Waiting for turning pointThe overall picture is sideway down.
TF Month
- Bear Signal
TF Week
- Close to the turning point

IS TESLA SETTING UP FOR A MULTI YEAR BULL RUN?2 week chart, let's break it down
Look at the RSI in the triangle pattern. It happened again in 2013 and price rocketed after we broke the upper end of that channel
I believe a similar thing is about to happen.
When you combine this with the golden cross that just formed on the Stochastic RSI, we are seeing momentum slowly shift.
It will take a period of about 1 - 4 months, but your worst case scenario is...
$165 is the bottom and we potentially rally from here to the $500s
You're only downside in this scenario is
1. we reach $500 by 2025
2. trade sideways between $500 and our previous all-time high of $415
3. then we correct with the rest of the stock & crypto market in the 2026 bear market
4. before bottoming out at $200 then going on an incredible run from 2027 to 2030
As Tesla investors, we need to be prepared for 2027 to 2030
1. When Interest Rates will be astronomically lower
2. Cybertruck is in full volume production @ 250K Cybertrucks / year.
3. The Model 3 & Y refresh are the most popular cars ever
4. the $25,000 Tesla is in full volume production and is championed as Tesla's "iPhone 4 moment"
5. The value of Energy, FSD & The Tesla Optimus Bot is fully realized in the valuation of the stock price, as well as the tailwind it will provide to earnings
6. Gigafactory Mexico + India & the Lithium Refinery in Texas are open for business, The Gigafactory Nevada expansion is complete & Tesla Semi enters Volume Production
----
Overall, if y'all Tesla Investors can fully stick through 2024 - 2027, you will do incredibly well in 2027 - 2030!

TESLA ABOUT TO ENTER A HISTORICAL BUY ZONE!!!Back on the 2 week chart, Tesla Stock is about to enter what is ridiculously oversold territory, the past 9 years of history has told you that this is the BEST TIME TO BUY
In addition, we entered this zone twice BEFORE making new all time highs, and the second time could be on the horizon
If you missed the dip of January 2023, DO NOT MISS THIS ONE!!!!

TSLA Re-testing Breakout from Bearish ChannelI will be watching this to see how it reacts between 230 and 245. This is a key level according to a bearish channel I've drawn on this daily chart.
I am not making a play right now.

Going long tslataking it all the way back to 187.50. its back in the box and taking a swing, may take another for next week also.

TSLA - There is a clear story to this chart. Here's what we needAlways tell a HTF story of the charts before getting bogged down in LTF chaos. These HTF algorithms control price.
Clear what we need to look out for on this TSLA chart - Yellow strong algorithm needs to activate to take us out of magenta and teal strong selling.
Fortunately for me, you can't laugh at this. These are the same algorithms proving themselves over and over again for years. Do this same thing on the hourly chart for more detail and you will be able to work yourself into many profitable positions and understand how price is reacting to and from these HTF algorithms.
Cheers to more knowledge, more profits, and to building a strong community in which we can all find consistency in our own styles of trading.
Happy Trading :)

TLSA to $160! TSLA breaks out and a potential $160 is in sight. Patient play with this one, as we know the market is gonna do what the market will do.
TSLA Double BottomSimple Double bottom chart pattern has been in making and it is presenting a bullish signal technically .
This means a movement towards the channel top of 221
Entry @ current price
Stop loss @ 168
TP @ 221

TSLA Projection Here's my prediction for NASDAQ:TSLA , based on the physics of a basketball.
I call this chart: The ball drop.
Because the Technoking dropped the ball.
I called the 2023 top on July 20th. Have it marked on my calendar. I was able to predict it back then using the ball drop technical chart.

TESLA: Bottomed and has huge upside potential.Tesla got almost oversold technically on the 1D timeframe (RSI = 36.047, MACD = -6.760, ADX = 34.229) as it made a new 10 month Low trading under both the 1D MA50 and MA200. The 1D CCI though is reversing, being traded inside a Channel Down. The previous two times this pattern emerged, Tesla formed a bottom. In November-December 2023 , the price rallied by +35.91% and in May-July 2023, by +97.38%. This gives us a buy opportunity with a huge upside potential, a short term target (TP = 235.50) and long term (TP = 340.00).
## If you like our free content follow our profile to get more daily ideas. ##
## Comments and likes are greatly appreciated. ##

More Pain for TSLA - $165 or LowerI get a lot of questions about TSLA, and I can tell that many of you are eager to buy this TSLA dip. However, I'm seeing a lot of bearish signs for TSLA and I don't think there will be a buy opportunity any time soon. The green support level has flipped into resistance, and TSLA is forming a strong move down this week. I have $164.76 as a key price target for a rebound. I think TSLA and the EV market are weak right now, we can see lower prices over the next few months.
