1TSLA trade ideas

Weekly price target on $Tesla I coded my own MA to show different price targets in the market! I think we can get a bullish push back to the levels of 203-213 depending on momentum

Tesla one more dip THEN a mega rallyPulled up the weekly chart with the stochastic RSI & I have found this sell off is EXACTLY like Q2 2019
Below, I calculated the days since the weekly S.RSI bottomed & we came to (8 bars, 56 days) which pointed me at where we stand today
Then I compared it to the 2019 sell off & found that 8 bars after the S.RSI hit rock bottom, it would put you at the April 29 candle!!
THE SAME CANDLE WHERE WE SAW A DEAD CAT BOUNCE
Now I don't have a crystal ball, but given how momentum isn't coming to Tesla right now despite a nice bounce...
I think one more dip will take place OVER the next 4 weeks, THEN a substantial rally from here
Ironically 4 weeks from now would be Q1 2024's earnings week, THAT could be the bottom in Tesla once & for all

IS TESLA FORMING BULLISH DIVERGENCE?On the 3 Day chart, there has NEVER been a point in time in which a Buy signal was printed, price goes lower, & RSI formed bullish divergence, but somehow we are here
RSI closed a higher low as indicated by both the RSI & CM indicator. I did not think price would go lower after the buy signal printed on Jan 29, but it looks like something is for sure cooking here
Important to note this divergence is larger than what sent price soaring 104% in Q1 2023...

Tesla (TSLA) Daily RSI DivergenceRecent FOMC meeting seem to have spurred renewed optimism in the markets. TSLA divergence here looks pretty strong imo.
We'll see how it goes, but excited to see how this plays out.

Tesla Monkey Nuts Bankroll doubleA very concise and clear prediction on tesla price action to close out the year

Nice place to buy TSLA according to TAI am watching carefully TSLA, as far as I have invested into it before and currently I would like to add to my position. I am watching if it will react on fibonacci's golden pocket and demand where it is currently.
There are some nice divergences forming as well, which indicates a nice entry to the trade.

The idea of analyzing the bull market in TeslaDear analysts and traders,
I hope you are doing well and are motivated for the week ahead. I wish you all the success in your business endeavors. Remember that success in trading lies in consistently defining and sticking to your rules.
As someone interested in the Elliott Wave Principle, I find it to be an invaluable tool for market analysis. I have developed my approach by combining this principle with my personal experience and by considering different scenarios that are likely to occur in the market. It should be noted that I do not like to be surprised in the market, and that's why I have different market prospects. I follow them to be sure and recognize the structure that is forming so that I can 100% recognize it.
I will share my analysis with you, but please note that I am not providing any buy or sell signals. My perspective on idea analysis is completely unbiased, so if the idea analysis meets your standards, you can use it as a guide to make an informed decision.
I have attached my previous analysis of the same market so that you can compare and see the differences. All the details of my analysis are clearly labeled, making it easy for you to understand. However, having a basic familiarity with the Elliott Wave Principle theory will help you understand the analytical idea more easily.
I have been studying the Elliott Wave Principle for almost three years now, and over time, my understanding of this knowledge and experience has grown. What I have achieved so far is the legacy of a genius called Ralph Nelson Eliot, and I am really happy with my progress. May peace be upon him.
Thank you for your support so far. I will always remember your kindness. Please share your comments and criticisms with me.
I hope my analysis will be useful to you in your business journey, and I wish you all the best.
Sincerely,
Mr. Nobody

TESLA The Target Is UP! BUY!
My dear friends,
TESLA looks like it will make a good move, and here are the details:
The market is trading on 163.56 pivot level.
Bias - Bullish
Technical Indicators: Supper Trend generates a clear long signal while Pivot Point HL is currently determining the overall Bullish trend of the market.
Goal - 180.44
Recommended Stop Loss - 154.73
About Used Indicators:
Pivot points are a great way to identify areas of support and resistance, but they work best when combined with other kinds of technical analysis
———————————
WISH YOU ALL LUCK

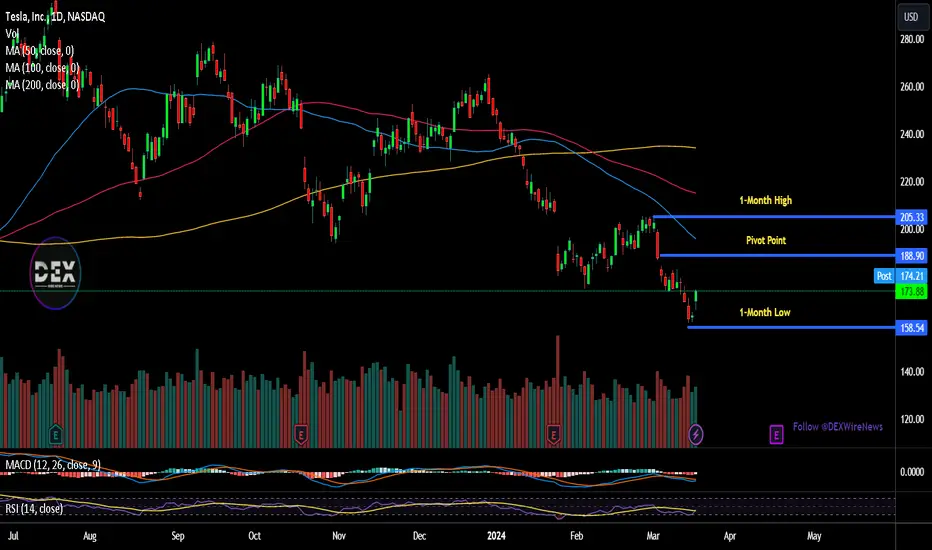
TSLA analysis: Price Returns to Above the $170 LevelTSLA analysis: Price Returns to Above the $170 Level, But for How Long?
After forming a low of the year on March 14, the TSLA share price managed to rise above the USD 170 level — investors reacted positively to Tesla’s decision to increase prices for electric vehicles in the US and Europe.
However, the TSLA stock market remains under pressure:
the TSLA price performs noticeably worse than the S&P 500 index;
the price forms a downward channel (shown in red);
Goldman Sachs analysts cut their forecast for Tesla shares to USD 190 from USD 220 for the next 12 months due to problems with production and sales.
Yahoo writes that investors are not happy with Musk's attitude. The fall in Tesla shares could quickly stop if the company gets a “real CEO” or Musk changes his position and returns to work and positively promoting the brand.
What is the market outlook?
Bullish arguments:
→ the price is near an important support zone, which is formed by the 2023 pattern: a bullish gap that has been successfully tested;
→ a decrease in the TSLA price below the lower border of the downward channel creates short-term oversold conditions in the market.
→ Fortune reported on March 15 that Cathie Wood's fund bought USD 35 million of TSLA stock.
Bearish arguments:
→ the bearish gap of early January works as resistance;
→ resistance may also include the psychological level of USD 200 and the median line of the descending channel.
At the same time, Barron's writes that the approaching earnings season is the biggest risk for Tesla shares right now. Tesla is expected to report electric vehicle deliveries of about 480,000 units in the first quarter of 2024, according to estimates from Bloomberg and FactSet. However, investors should pay attention to more recent estimates that have emerged in the last couple of weeks — they point to a figure of around 430,000 units.
Actual values below expectations may significantly lower the price of TSLA shares — it is possible that the price will continue to move within the descending channel, breaking through the support area. The news release is scheduled for April 17.
This article represents the opinion of the Companies operating under the FXOpen brand only. It is not to be construed as an offer, solicitation, or recommendation with respect to products and services provided by the Companies operating under the FXOpen brand, nor is it to be considered financial advice.

How to Trade with the Inside Bar PatternHow to Trade with the Inside Bar Pattern
The inside bar pattern is characterised by two consecutive candlesticks that often suggest a period of consolidation or indecision in the market. Traders and analysts can find value in identifying the setup as it can provide insights into potential future price movements. In this article, we will explore different examples of this formation on price charts and discuss how to interpret their signals for trading purposes.
What Is an Inside Bar Candle Pattern?
An inside bar is a two-candlestick formation that occurs when a candlestick's high and low range is contained within the high and low range of the preceding candle. In other words, the entire price action of one candle is confined within the previous candlestick's price range.
The setup signifies a period of consolidation or indecision in the market; however, it doesn’t identify a trend reversal. The price may continue moving in the prevailing trend or turn around. Also, the pattern may appear both in an uptrend and in a downtrend. It indicates that the trading range of the current candle is narrower than the range of the previous candlestick. This contraction in price volatility suggests a temporary equilibrium between buyers and sellers.
The inside bar can be observed across different financial instruments such as stocks, cryptocurrencies*, ETFs, indices, and forex currency pairs and can be traded using contracts for difference (CFDs) provided by FXOpen.
Identifying the Inside Bar on Trading Charts
To identify this formation on trading charts, traders follow these steps:
Look for two candlesticks: Start by identifying a candlestick with a defined high and low range and check a subsequent candlestick.
Compare the high and low range: Check if the high and low range of the subsequent candle is entirely contained within the high and low range of the preceding candlestick. The entire price action of the following candles should be within the boundaries of the last candlestick.
Confirmation: Once identifying that the subsequent candle meets the criteria, traders can confirm it as an inside bar.
Inside Bar vs Outside Bar
The inside candle pattern occurs when the high and low of a candle are contained within the range of the preceding candlestick, indicating consolidation or indecision in the market. It suggests a potential reversal or continuation of the current trend. On the other hand, an outside bar, or engulfing pattern, happens when the high and low of a candlestick completely engulf the previous candle, signalling a potential reversal. A bearish engulfing indicates a bearish reversal, while a bullish engulfing suggests a bullish reversal. Both are widely used by traders for technical analysis and identifying potential trading opportunities.
Traders can analyse outside and inside bars on forex, stocks, and other markets for free using the FXOpen TickTrader platform.
How to Trade Inside Bar Pattern
Trading with the inside bar candlestick pattern involves using it as a signal for potential breakouts or continuation of the prevailing trend. Here are the steps traders usually follow when trading with the pattern:
Determine the direction of the preceding trend: Traders assess the overall trend leading up to the formation. If it's an uptrend, the preceding candles should be mostly bullish. If it's a downtrend, the prior candles should be mostly bearish.
Wait for a breakout: The formation indicates consolidation and potential price compression. Traders often wait for a breakout from the setup's range to initiate a trade. A breakout above the high of the formation suggests a bullish signal, while a breakout below the low indicates a bearish signal.
Set your entry: Once the breakout occurs, traders may set the entry order slightly above the high of the bullish breakout or slightly below the low of the bearish breakout.
Consider additional confirmation: To increase the probability of a successful trade, traders may look for additional confirmation indicators such as volume analysis, trendlines, or other technical indicators to support your trade decision. An increasing volume at the breakout or the breakout from a trendline may provide additional confluence.
Manage your trade: As the trade progresses, traders monitor price movements and may want to adjust your stop-loss level to protect profits or limit losses.
Take profits: Traders may decide on your profit-taking strategy, whether it's a predetermined target, a trailing stop, or monitoring key levels of support and resistance.
Live Market Example
Below we present an inside bar stock pattern on Tesla. It contains a bullish inside bar. Following the inside bar trading strategy, the trader waits for the breakout above the setup marked by a horizontal line. The stop loss is set below the low of the formation, and the take profit is at the next resistance.
Final Thoughts
While the setup can be a useful tool for identifying potential breakout or continuation opportunities, it's important for traders not to rely solely on this pattern for their trading decisions. To enhance their analysis, traders combine the formation with other technical indicators and utilise effective risk management strategies to manage potential losses.
It's crucial to exercise caution and be mindful of false signals that can occur. Traders try to adapt their trading strategies accordingly to improve their chances of success. To develop your own trading strategy with this pattern, you can open an FXOpen account.
FAQ
Is an inside bar bullish or bearish?
It does not inherently indicate a bullish or bearish bias. It simply represents a period of consolidation or indecision in the market. So, the formation occurring within an uptrend can be bullish and signal a trend continuation or bearish and signal a trend reversal.
What does an inside bar bullish mean?
The meaning of an inside candle that is bullish refers to an inside bar, after which the price moves upwards. When this pattern forms during an uptrend, it suggests a temporary pause or consolidation in price before the uptrend potentially resumes. When it is formed in a downtrend, it signals a trend reversal.
How do you use the inside bar strategy?
To use the strategy, traders wait for the inside bar to form and then look for a breakout above the high of the formation to enter a long position or below the low to enter a short trade. A stop-loss order is typically placed below the low of the pattern in a long trade and above the high of the pattern in a short trade. Profit targets can be determined based on the trader's trading plan, technical indicators, or key support and resistance levels.
* At FXOpen UK and FXOpen AU, Cryptocurrency CFDs are only available for trading by those clients categorised as Professional clients under FCA Rules and Professional clients under ASIC Rules, respectively. They are not available for trading by Retail clients.
This article represents the opinion of the Companies operating under the FXOpen brand only. It is not to be construed as an offer, solicitation, or recommendation with respect to products and services provided by the Companies operating under the FXOpen brand, nor is it to be considered financial advice.

Tesla to drop to 110 $ but 5.5x after to over 500$Elon musk to have half a trillion dollars when tesla hits over 550$
I would get out of Tesla soon and rejoin later this year.

TSLA is gonna make or break meim already long tsla off the bounce. looking to continue the uptrend back into the 200s
july-aug expiration maybe?

FREE #OPTIONS Ideas WATCH FOR FOMC BREAKOUTSFREE #OPTIONS Ideas
Scale out when above 25% Profit
AMEX:SPY 516C>515.51 | 511P<511.61
NASDAQ:TSLA 175C>172.28 | 165P<167.96
NASDAQ:DKNG 44C>43.65 | 42P<42.29
NYSE:ORCL 129C>128.94 | 126P<126.76
LIKE IF YOU WANT THESE DAILY!

TSLA Rebounds from $164.76 Support LevelMy TSLA forecast has been one of my most accurate predictions so far, and TSLA has reached the $164.76 price target discussed in my previous updates. NASDAQ:TSLA initially dipped below the $164.76 support level, but had a bullish rebound at the support line. TSLA is red today, but could be forming a bullish retest of the $164.76 support line. I would keep an eye on the $164.76 support level on the way down to see if it holds or whether TSLA loses support here.

TSLA - Solid Bullish Divergence TSLA has been a solid short but I have a hard time believing that this stock is down for the count. Apparently I am not the only person who is thinking this way because in spite of the downside price action, the RSI (Relative Strength Index) is indicating that sentiment is overall bullish still and price should reflect it in the short term. I don’t know if I feel super bullish with the macro outlook but as far as expecting a decent bounce out of TSLA in the short term- probability points to more likely than not- upside price action in the short term.

TESLA on the cross roadsTesla is at an important support level of $160. Currently it is not clear if it will recover or dip down further.
Here are 2 scenarios i am preparing for.
1) Bullish a recovery to $225
2( Bearish a further decline to $100
What do you think?

TSLA is about to go on a run to new ATHs from here...(REPOSTED) - I made the same post on 31/07, but now it is hidden by Tradingview.
...but you wouldn't believe it.
The asset shows signs of being close to its ascent towards new price discoveries after a corrective period.
Observe the consolidation patterns of waves II and IV. The first corrective period was long, so this one tends to be short.
Notice how the reversal pattern became clear much faster in wave IV.
Thanks!

Time to cover the previous lossIt is almost impossible to have %100 accuracy for trend prediction however not getting disappointed by a loss, observing capital management and always always having a stop loss keeps you in the game. Remember market is a long run game where those who manage to survive make profit.

Tesla Shares Up 6.3% on Model Y Price Hike in US, EuropeIn a strategic maneuver to bolster sales and navigate shifting market dynamics, Tesla ( NASDAQ:TSLA ) recently announced price hikes for its Model Y electric vehicles across select regions, triggering a surge in its stock price amidst a backdrop of evolving challenges and opportunities.
Seizing Momentum Amidst Price Adjustments:
Tesla's decision to increase Model Y prices in both Europe and the United States has sparked a flurry of investor interest, propelling its shares by nearly 7%. The move, which includes a $1,000 hike for U.S. customers and a 2,000 euros increase for European buyers, underscores Tesla's agility in responding to market conditions while seeking to optimize revenue streams.
Navigating Market Sentiments:
Despite the immediate market enthusiasm, analysts remain cautious, citing concerns over persistently high Model Y inventory and interpreting the price adjustments as a short-term sales stimulus rather than a reflection of robust demand. Goldman Sachs analysts, in particular, have revised their 12-month price target downward, highlighting challenges in Model 3 production ramp-up and operational disruptions at Tesla's Berlin gigafactory.
Evolving Market Landscape:
Tesla's strategic maneuvers unfold against a backdrop of evolving market dynamics, including reduced electric vehicle subsidies in Europe, intensifying competition in China—the company's second-largest market—and signs of slowing demand. While analysts acknowledge Tesla's strong position in the electric vehicle and clean energy sectors, they caution that near-term market conditions could impact earnings and growth trajectories.
Strategic Outlook:
Despite near-term headwinds, Tesla ( NASDAQ:TSLA ) remains well-positioned for long-term growth, leveraging its market leadership and technological prowess in the electric vehicle and clean energy sectors. The company's ability to navigate market challenges while sustaining innovation will be pivotal in shaping its trajectory in the competitive landscape of the automotive industry.
TSLA is breaking downTSLA have different bad news and Morgan Stanley cuts Tesla price target on slowing EV demand is only one of them
Technically speaking it also looks very weak, selling off on big volume, making new lows with no support till 120ish.
We'll see...

TSLA at weekly support, likely to bounce to at least 200 areaThe price had hit the weekly support WS1 after getting rejected from weekly resistance WR1. After hitting WS1, the price has bounced and I believe this bounce will continue towards weekly resistance WR1. Therefore, this present an opportunity to go long on this one for the target at least to the weekly resistance WR1. There is a possibility of it breaking this resistance and move towards monthly resistance MR1. However, we shall re-evaluate the price action in case it reaches to the first target at WR1.

TSLA- My plan for the start of next week Hello,
This is my trading plan for the start of next week. If this was a normal week, without much economic news, I would be much more confident about what will happen, but remember, this week is the Fed meeting and that can change a lot. On the other hand, after the close on Friday, a price hike on the Model Y in US and EU was also announced, which I believe will lead to a sharp price increase on Monday. In this case, because of the Fed, it may not be so sharp because of that, I will do the following:
1) Immediately after the opening of the early trade, I will buy and replenish the positions I have already bought.
2) The Figure shows the potential areas where, in my opinion, profit can be taken (areas in green). Because I already have accumulated positions I will probably sell at the bottom of zone one, around $168.8-$169.2 Depending on the price action, however, I may increase to the bottom of the resistance around $170.2. I hope this all happens on Monday.
2) On Tuesday I will move to close positions at the second level that I have set for profit. After that I'll be watching the Fed because while most people are convinced there won't be a rate change because of the latest inflation data, I'm not so convinced...
