MLNUSDT Forming Bullish MomentumMLNUSDT is forming a clear Bullish Momentum pattern, a classic bullish reversal signal that often indicates an upcoming breakout. The price has been consolidating within a narrowing range, suggesting that selling pressure is weakening while buyers are beginning to regain control. With consistent vol
Related pairs

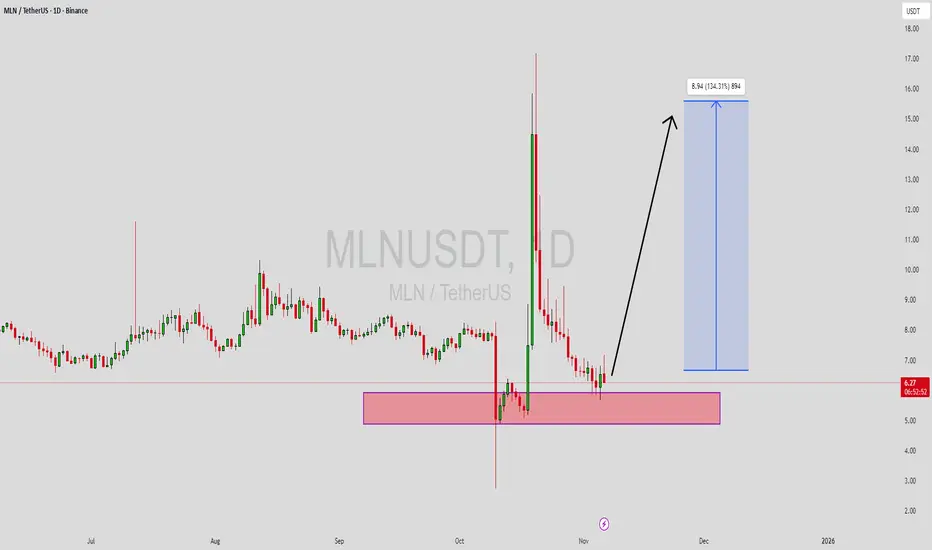
MLN has shown a strong bullish breakout after a long period of cThe breakout candle is supported by a clear increase in volume, indicating fresh buying pressure entering the market. Price is now retesting the breakout zone, offering a high-probability continuation setup. As long as the retest holds above the previous range, the trend is expected to extend toward

Scalp Long – MLN📈 Scalp Long – MLN
Strong buying momentum is returning across lower timeframes, and price action indicates a potential move to retest the local high. The price is currently holding above a solid support zone, suggesting a favorable setup for continuation.
🎯 Trade Setup:
Take Profit (TP): 6.49
St


MLNUSDT Forming Bullish WaveMLNUSDT is forming a clear bullish wave pattern, a dynamic Elliott impulse signal that points to building upward momentum in the DeFi asset management space. Trading around $6.20 USDT with a $19 million market cap, the token has traced higher lows and accelerating swings since its October base near
MLN - BULLISH BREAKOUTAre we gonna see the bullish wave I waited for last week on CBOE:MLN ?? 🚀🚀🚀
Retest HTF valid above 7.40$.
Chart looks pretty ready to fly toward 12$+ or even new high! 📈

MLN - BULL REACTION AWAITEDCBOE:MLN , as long as price hold above 8.20$ I'll do DCA. Expecting to see another big bull reaction 📈

MLN - VERY BULLISH BREAKOUT 🚨 SPOT BREAKOUT ALERT 🚨
I see a solid and clean breakout + retest daily on MLN / USDT 🚀
✅Perfect daily retest of the 10.40$ previous KEY resistance.
✅HTF Trend reversal
✅Ichimoku reyest (Kijun)
✅Strong buy volume
⚠️Better to wait for a weekly candle break above 18.20$ for full confirmati

MLN is on the prime time longA slight rebound on the trend before the take off
Well let's see, the BTC will dictate if this move will work or not
Once again remember do not take the full move, sell when satisfied, especially if leverage are used

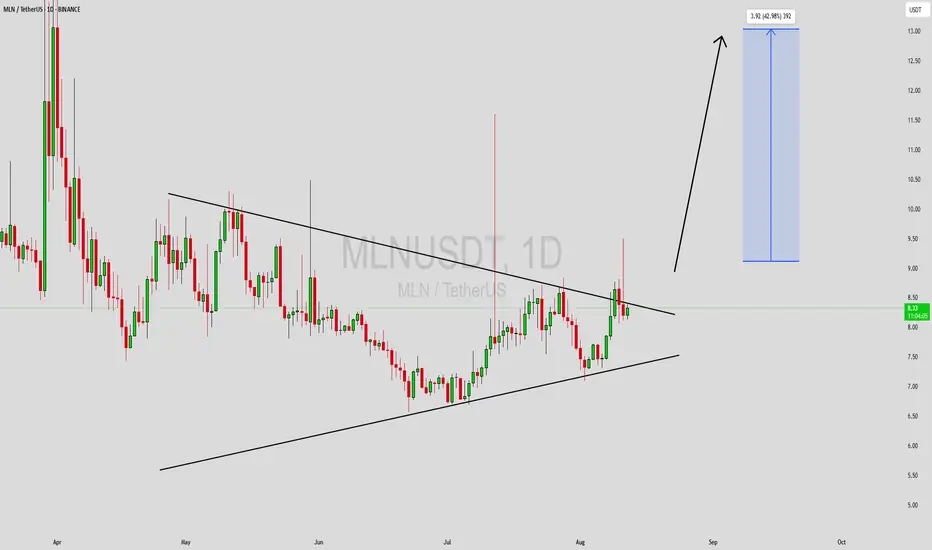
MLNUSDT Forming Symmetrical TriangleMLNUSDT (Enzyme Finance Token) is carving out a symmetrical triangle pattern, a consolidation structure where price action tightens between converging support and resistance trendlines. This setup reflects a standoff between bulls and bears, often resolved with a breakout in either direction—tending
See all ideas
Summarizing what the indicators are suggesting.
Oscillators
Neutral
SellBuy
Strong sellStrong buy
Strong sellSellNeutralBuyStrong buy
Oscillators
Neutral
SellBuy
Strong sellStrong buy
Strong sellSellNeutralBuyStrong buy
Summary
Neutral
SellBuy
Strong sellStrong buy
Strong sellSellNeutralBuyStrong buy
Summary
Neutral
SellBuy
Strong sellStrong buy
Strong sellSellNeutralBuyStrong buy
Summary
Neutral
SellBuy
Strong sellStrong buy
Strong sellSellNeutralBuyStrong buy
Moving Averages
Neutral
SellBuy
Strong sellStrong buy
Strong sellSellNeutralBuyStrong buy
Moving Averages
Neutral
SellBuy
Strong sellStrong buy
Strong sellSellNeutralBuyStrong buy
Displays a symbol's price movements over previous years to identify recurring trends.
Frequently Asked Questions
The current price of MLN / TetherUS (MLN) is 3.68 USDT — it hasn't changed in the past 24 hours. Try placing this info into the context by checking out what coins are also gaining and losing at the moment and seeing MLN price chart.
MLN / TetherUS price has risen by 4.38% over the last week, its month performance shows a −23.49% decrease, and as for the last year, MLN / TetherUS has decreased by −72.41%. See more dynamics on MLN price chart.
Keep track of coins' changes with our Crypto Coins Heatmap.
Keep track of coins' changes with our Crypto Coins Heatmap.
MLN / TetherUS (MLN) reached its highest price on Sep 22, 2021 — it amounted to 234.80 USDT. Find more insights on the MLN price chart.
See the list of crypto gainers and choose what best fits your strategy.
See the list of crypto gainers and choose what best fits your strategy.
MLN / TetherUS (MLN) reached the lowest price of 2.73 USDT on Oct 10, 2025. View more MLN / TetherUS dynamics on the price chart.
See the list of crypto losers to find unexpected opportunities.
See the list of crypto losers to find unexpected opportunities.
The safest choice when buying MLN is to go to a well-known crypto exchange. Some of the popular names are Binance, Coinbase, Kraken. But you'll have to find a reliable broker and create an account first. You can trade MLN right from TradingView charts — just choose a broker and connect to your account.
Crypto markets are famous for their volatility, so one should study all the available stats before adding crypto assets to their portfolio. Very often it's technical analysis that comes in handy. We prepared technical ratings for MLN / TetherUS (MLN): today its technical analysis shows the sell signal, and according to the 1 week rating MLN shows the sell signal. And you'd better dig deeper and study 1 month rating too — it's sell. Find inspiration in MLN / TetherUS trading ideas and keep track of what's moving crypto markets with our crypto news feed.
MLN / TetherUS (MLN) is just as reliable as any other crypto asset — this corner of the world market is highly volatile. Today, for instance, MLN / TetherUS is estimated as 0.82% volatile. The only thing it means is that you must prepare and examine all available information before making a decision. And if you're not sure about MLN / TetherUS, you can find more inspiration in our curated watchlists.
You can discuss MLN / TetherUS (MLN) with other users in our public chats, Minds or in the comments to Ideas.