"Smart Money Alert | RTS Index Could Hit 40,000+"🚀 The next big wave isn’t coming — it’s already forming.
RTSI – The Birth of a New Macro Wave! 🌊
The RTS Index (RTSI) appears to have completed a multi-decade Elliott Wave cycle correction — setting the stage for a massive Wave 5 expansion.
📉 Wave Breakdown:
🌊 Wave 1: The early post
Related indices

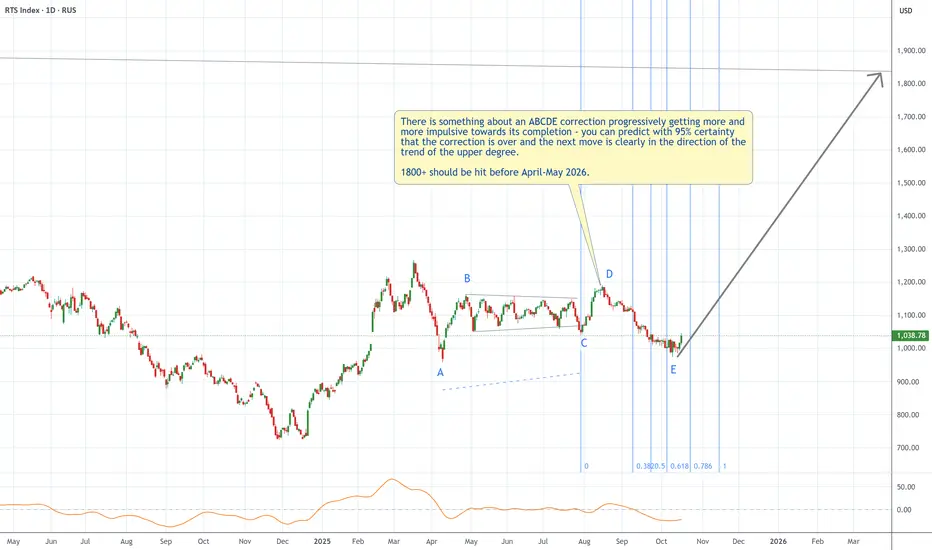
The Russian market is about to explode higherThere is something about an ABCDE correction progressively getting more and more impulsive towards its completion - you can predict with 95% certainty that the correction is over and the next move is clearly in the direction of the trend of the upper degree.
1800+ should be hit before April-May 202
RTS IndexCurrently RTS index is testing the resistance around 920. The resistance level is strong and RTS will consolidate below this level. RTS has been in major consolidation since 2011 and now the spring will be compressing, preparing for a major decline. Targets are mentioned on chart.
More likely the t

I See further upside to RTS (Russian Stock Index)If 1340 pivot would be passed ATR could go up and we can see 1400 on RTS. Oil is bouncing from key technical level MOEX:RTSI

The 2023 master plan is pretty clearThere will be an overwhelming amount of events happening in H2'23:
- A crash in Treasuries (10Y above 10%)
- A crash in EURUSD (0.75 is waiting)
- A totally unexpected move in USDJPY to 100
- A crash in SPX below 1500
- A crash in RTS to 250..300
- A silent withdrawal of financing of Ukr

9 years = 4000%RTS now is young child before grow and jump of teenager
Russia have all resourses may be in world
only one country and all resourses.... big volume resourses

Dimensions of market horrorsJust comparing the size of market drops for illustration purposes... Definitely this one is not the biggest... Definitely greater one is in future...

RTSI - possibly greater downfall ?Against the background of the expectations of tougher sanctions together with the absence of obvious peaceful ways to resolve the problem with Russian war of aggression, plus the structural degradation of the economy and "SME" business defaults and export embargo, here it comes an understanding is c

1050 should be reached before the crash resumesA new minor high is due in the next couple of weeks. The Russian market will be lifted by the last bullish wave worldwide. Then the downtrend will resume.
7 months to form 1-2-1-2, means at least another 7 months to hit the low. It's not about Russia: the crash will be a worldwide affair. It will b

Negative scenario on rts index with deep crab patternsThere are 2 variants both lead to very low values.
But one of them lets ~30% grows first.

See all ideas
Summarizing what the indicators are suggesting.
Oscillators
Neutral
SellBuy
Strong sellStrong buy
Strong sellSellNeutralBuyStrong buy
Oscillators
Neutral
SellBuy
Strong sellStrong buy
Strong sellSellNeutralBuyStrong buy
Summary
Neutral
SellBuy
Strong sellStrong buy
Strong sellSellNeutralBuyStrong buy
Summary
Neutral
SellBuy
Strong sellStrong buy
Strong sellSellNeutralBuyStrong buy
Summary
Neutral
SellBuy
Strong sellStrong buy
Strong sellSellNeutralBuyStrong buy
Moving Averages
Neutral
SellBuy
Strong sellStrong buy
Strong sellSellNeutralBuyStrong buy
Moving Averages
Neutral
SellBuy
Strong sellStrong buy
Strong sellSellNeutralBuyStrong buy
Displays a symbol's price movements over previous years to identify recurring trends.