Review and plan for 14th November 2025 Nifty future and banknifty future analysis and intraday plan.
Quarterly results- analysed.
This video is for information/education purpose only. you are 100% responsible for any actions you take by reading/viewing this post.
please consult your financial advisor before taking any action.
--
Next report date
—
Report period
—
EPS estimate
—
Revenue estimate
—
3.51 INR
38.03 B INR
1.13 T INR
4.44 B
About Samvardhana Motherson International Limited
Sector
Industry
Website
Headquarters
Mumbai
Founded
1986
ISIN
INE775A01035
FIGI
BBG000CWNM56
Samvardhana Motherson International Ltd. is a holding company, which engages in the manufacture and sale of wire harnesses, components, and wires to automotive original equipment manufacturers. It operates through the following segments: Wiring Harness, Modules and Polymer Products, and Emerging Businesses. The Wiring Harness segment focuses mainly on the business of manufacturing and trading of wiring harness, its components and rendering of support service function exclusively to wiring harness operations. The Modules and Polymer Products segment includes manufacturing and supplies of plastic parts and system modules for vehicle interiors and exteriors. The Emerging Businesses segment refers to the Elastomers, Precision Metals and Modules, and Services operations of the company. The company was founded by Swarn Lata Sehgal on December 19, 1986 and is headquartered in Mumbai, India.
Related stocks

Samvardhana Motherson International Ltd – Trendline BreakoutSamvardhana Motherson International Ltd – Trendline Breakout on Radar
NSE:MOTHERSON
📈 Pattern & Setup:
Samvardhana Motherson is showing signs of strength after a long consolidation phase. The stock has been forming a **descending trendline** since its 2024 peak and is now gradually tightening

MOTHERSON | Buy above 114 | SL below 107 on closing basisMOTHERSON | Buy above 114 | SL below 107 on closing basis | Targets 126, 147
Disclaimer (Please Read Carefully):
This is not investment advice. The stocks shared here are purely for educational and informational purposes. Please do your own research or consult with a financial advisor before mak

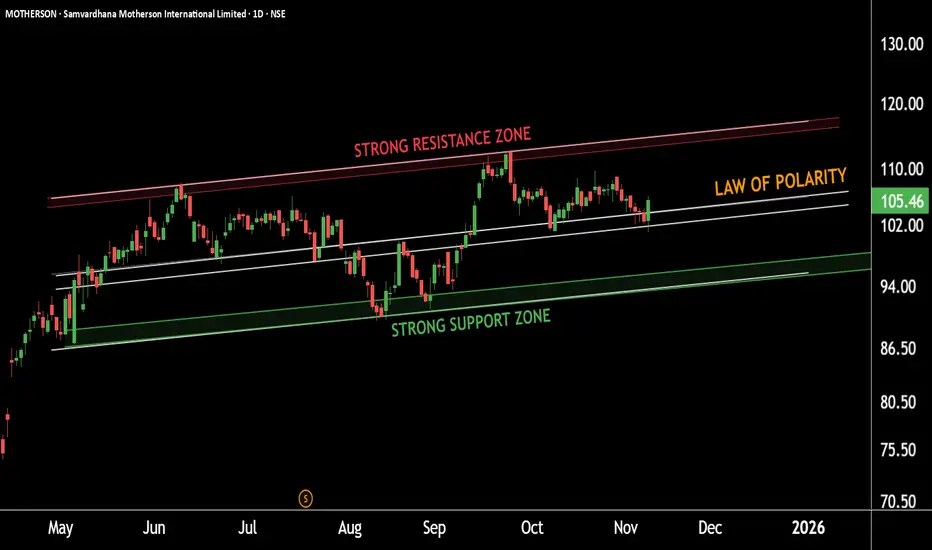
Motherson On Radar: Key Level Trigger Before The BreakoutThis is the daily timeframe chart of Samvardhana Motherson.
The stock is moving within a well-defined parallel channel and is currently sustaining above the upper band near the 100 level.
A strong support zone lies at 90–93. If the stock continues to hold above this zone,
we may see higher levels
MOTHERSON @ 109: Analysis on 19-Sep-2025Supports: 71/41/16
Resistance: 145
As long as the above supports hold, we can see
Min. target: 157-172-190
199
Normal target: 219-234-277
310
Ultimate target: 331-355-385
Extension: 466-494-510-548

Samvardhana Motherson International Ltd. (NSE) (W)After a prolonged downtrend, price has been consolidating near the lows and has now shown a strong bullish move.
Currently trading at ₹104.69 zone.
The structure suggests a potential bottoming out and start of a recovery rally.
Key Levels
Supports:
₹94.62 (First support)
₹77.92 (major long-term b

motherson can fall from here Bearish trend will start and can find support close to 87 levels. so its good time to sell
Sell 97.7
sl 102
target 87

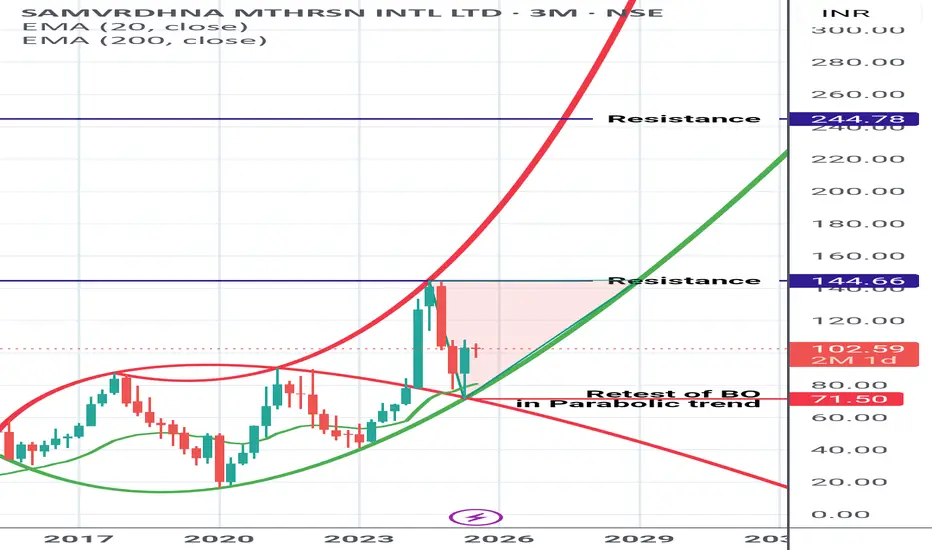
Samvardhna Motherson Getting ready Samvardhna Motherson
Earlier mentioned about Elliptical Pattern Breakout and the Rally in it .
Currently retesting the Parabolic trend support and trading inside the Triangular zone.
View is : Slowly getting ready for big rally. Stay invested.
Purely based on My STUDY . Lets see how it works.
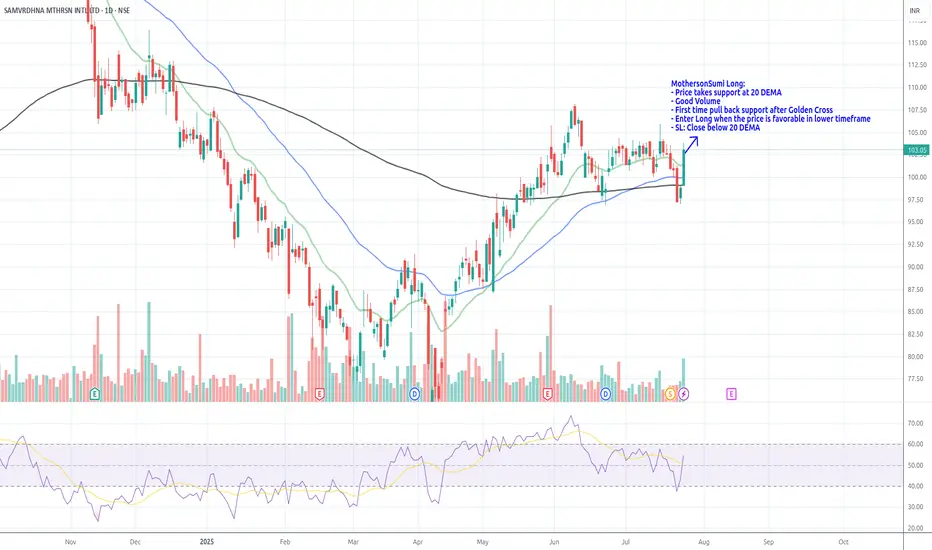
MothersonSumi Long_Support @ 20 DEMAMothersonSumi Long:
- Price takes support at 20 DEMA
- Good Volume
- First time pull back support after Golden Cross
- Enter Long when the price is favorable in lower timeframe
- SL: Close below 20 DEMA
Samvardhana Motherson Good to buySamvardhana Motherson International Ltd (153 ) is in uptrend. Expected Target 187. Stock is trading at 28.8 of its FY26 EPS and have ROE @23.46 and ROCE @ 13.96 and maintains a health dividend of 0.56. So We find this as undervalued at current price and has potential to move to target with support a

See all ideas
Summarizing what the indicators are suggesting.
Neutral
SellBuy
Strong sellStrong buy
Strong sellSellNeutralBuyStrong buy
Neutral
SellBuy
Strong sellStrong buy
Strong sellSellNeutralBuyStrong buy
Neutral
SellBuy
Strong sellStrong buy
Strong sellSellNeutralBuyStrong buy
An aggregate view of professional's ratings.
Neutral
SellBuy
Strong sellStrong buy
Strong sellSellNeutralBuyStrong buy
Neutral
SellBuy
Strong sellStrong buy
Strong sellSellNeutralBuyStrong buy
Neutral
SellBuy
Strong sellStrong buy
Strong sellSellNeutralBuyStrong buy
Displays a symbol's price movements over previous years to identify recurring trends.
M
US784572AA7
Motherson Global Investments B.V. 5.625% 11-JUL-2029Yield to maturity
5.12%
Maturity date
Jul 11, 2029
M
SMRA5845430
Motherson Global Investments B.V. 5.625% 11-JUL-2029Yield to maturity
4.89%
Maturity date
Jul 11, 2029
815SMIL26
Samvardhana Motherson International Limited 8.15% 23-JAN-2026Yield to maturity
—
Maturity date
Jan 23, 2026
810SMIL28
Samvardhana Motherson International Limited 8.1% 04-OCT-2028Yield to maturity
—
Maturity date
Oct 4, 2028
609SMIL26
Samvardhana Motherson International Limited 6.09% 25-NOV-2026Yield to maturity
—
Maturity date
Nov 25, 2026
680SMIL30
Samvardhana Motherson International Limited 6.8% 27-JUN-2030Yield to maturity
—
Maturity date
Jun 27, 2030
See all MOTHERSON bonds
Frequently Asked Questions
The current price of MOTHERSON is 112.38 INR — it has increased by 0.43% in the past 24 hours. Watch Samvardhana Motherson International Limited stock price performance more closely on the chart.
Depending on the exchange, the stock ticker may vary. For instance, on NSE exchange Samvardhana Motherson International Limited stocks are traded under the ticker MOTHERSON.
MOTHERSON stock has risen by 5.96% compared to the previous week, the month change is a 7.58% rise, over the last year Samvardhana Motherson International Limited has showed a 1.82% increase.
We've gathered analysts' opinions on Samvardhana Motherson International Limited future price: according to them, MOTHERSON price has a max estimate of 140.00 INR and a min estimate of 85.00 INR. Watch MOTHERSON chart and read a more detailed Samvardhana Motherson International Limited stock forecast: see what analysts think of Samvardhana Motherson International Limited and suggest that you do with its stocks.
MOTHERSON reached its all-time high on Sep 27, 2024 with the price of 144.66 INR, and its all-time low was 0.06 INR and was reached on Jan 22, 1999. View more price dynamics on MOTHERSON chart.
See other stocks reaching their highest and lowest prices.
See other stocks reaching their highest and lowest prices.
MOTHERSON stock is 1.44% volatile and has beta coefficient of 1.77. Track Samvardhana Motherson International Limited stock price on the chart and check out the list of the most volatile stocks — is Samvardhana Motherson International Limited there?
Today Samvardhana Motherson International Limited has the market capitalization of 1.15 T, it has increased by 5.20% over the last week.
Yes, you can track Samvardhana Motherson International Limited financials in yearly and quarterly reports right on TradingView.
Samvardhana Motherson International Limited is going to release the next earnings report on Feb 14, 2026. Keep track of upcoming events with our Earnings Calendar.
MOTHERSON earnings for the last quarter are 0.78 INR per share, whereas the estimation was 0.73 INR resulting in a 6.12% surprise. The estimated earnings for the next quarter are 0.85 INR per share. See more details about Samvardhana Motherson International Limited earnings.
Samvardhana Motherson International Limited revenue for the last quarter amounts to 301.73 B INR, despite the estimated figure of 298.43 B INR. In the next quarter, revenue is expected to reach 316.89 B INR.
MOTHERSON net income for the last quarter is 8.27 B INR, while the quarter before that showed 5.12 B INR of net income which accounts for 61.57% change. Track more Samvardhana Motherson International Limited financial stats to get the full picture.
Samvardhana Motherson International Limited dividend yield was 0.65% in 2024, and payout ratio reached 15.45%. The year before the numbers were 1.03% and 19.96% correspondingly. See high-dividend stocks and find more opportunities for your portfolio.
As of Nov 20, 2025, the company has 127.89 K employees. See our rating of the largest employees — is Samvardhana Motherson International Limited on this list?
EBITDA measures a company's operating performance, its growth signifies an improvement in the efficiency of a company. Samvardhana Motherson International Limited EBITDA is 103.98 B INR, and current EBITDA margin is 9.08%. See more stats in Samvardhana Motherson International Limited financial statements.
Like other stocks, MOTHERSON shares are traded on stock exchanges, e.g. Nasdaq, Nyse, Euronext, and the easiest way to buy them is through an online stock broker. To do this, you need to open an account and follow a broker's procedures, then start trading. You can trade Samvardhana Motherson International Limited stock right from TradingView charts — choose your broker and connect to your account.
Investing in stocks requires a comprehensive research: you should carefully study all the available data, e.g. company's financials, related news, and its technical analysis. So Samvardhana Motherson International Limited technincal analysis shows the strong buy rating today, and its 1 week rating is strong buy. Since market conditions are prone to changes, it's worth looking a bit further into the future — according to the 1 month rating Samvardhana Motherson International Limited stock shows the buy signal. See more of Samvardhana Motherson International Limited technicals for a more comprehensive analysis.
If you're still not sure, try looking for inspiration in our curated watchlists.
If you're still not sure, try looking for inspiration in our curated watchlists.