
MOVR fresh simple idea ATH Q1 2025Using a new chart to simply see where MOVR could go this cycle.
Base Idea is that recession will ensue post Trump inauguration and that will send all markets into turmoil.
Timeframe Feb 2025
With this in mind I don't see a NEW ATH for MOVR but a new cycle high for sure.
Idea's posted on chart us

Possible MOVR price moving forwardStill unsure if a correction or impulse is playing out.
Time is running out and 5 wave move seems unlikely to fully complete within the remaining time of 2025. Alternating long W2 to a short W4 could aid in the new local high price.
Alternate ABC corrective count still bullish short and mid term b

Moonriver Trading at Opportunity Buy Zone · 2,600% PPMoonriver (MOVRUSDT) is doing great right now and there are many reasons why this is so. This is a good chart with a strong project. This combination gives us huge potential for growth.
MOVRUSDT grew more than 1,000% in late 2023. This was only small jump and much more is possible when the market i

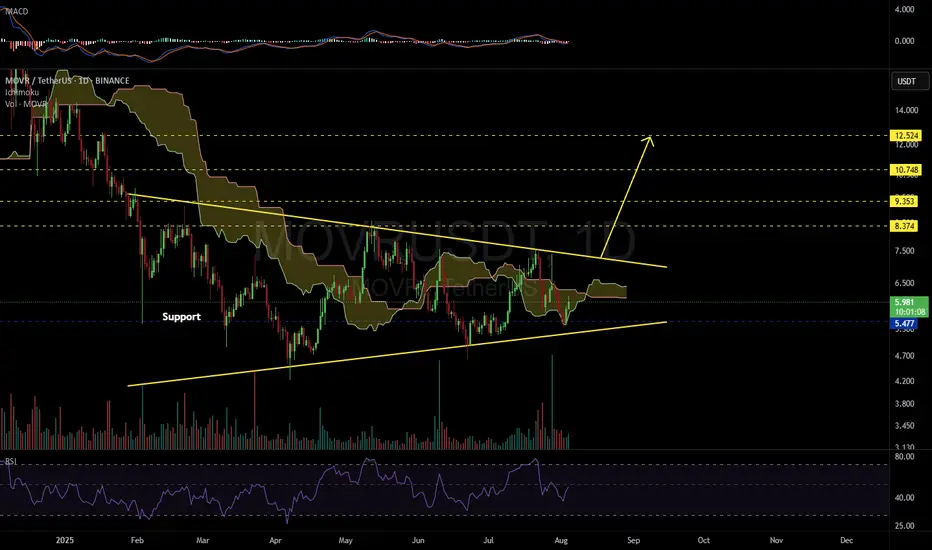
MOVRUSDT Forming Descending ChannelMOVRUSDT is currently trading within a Descending Channel Pattern, a formation that typically precedes a strong breakout to the upside once the downward pressure begins to fade. This pattern indicates a period of consolidation where lower highs and lower lows are formed in a controlled channel, ofte
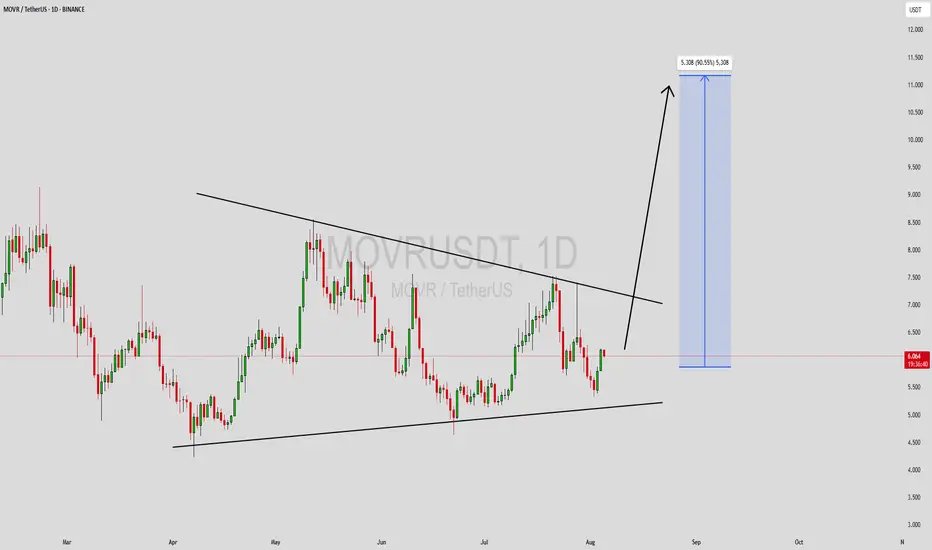
MOVRUSDT 1D#MOVR is moving inside a symmetrical triangle on the daily chart and has recently bounced from the edge of the Ichimoku Cloud — a promising sign of strength.
📌 Consider buying at the current level and near the support zone at $5.477.
In case of a breakout above the triangle resistance, the potenti
MOVR | Flag PatternFlag pattern is about te break out level, after confirmed break out in daily timeframe, expecting 50% bullish wave

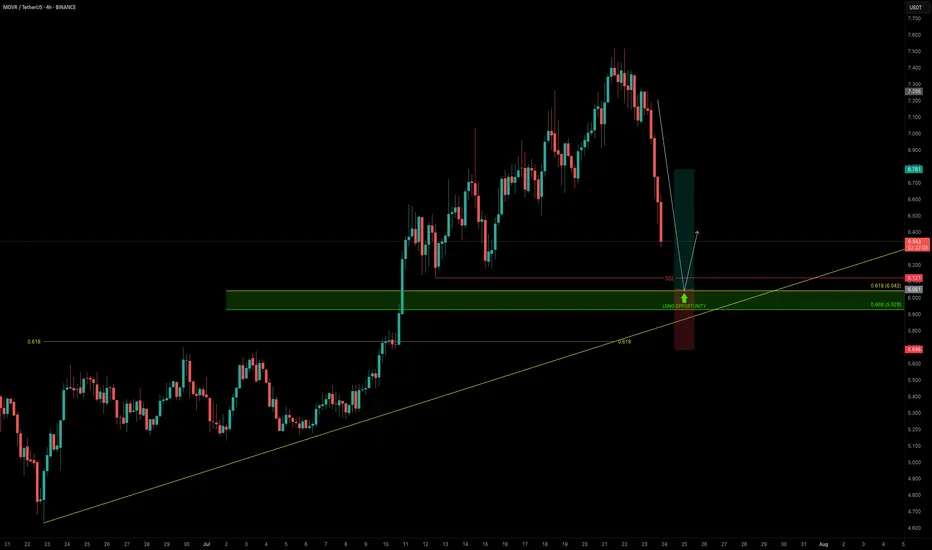
MOVR — Buying the Dip Into Confluence SupportAs the broader market pulls back, it’s the perfect time to scan for high-conviction long setups — and MOVR stands out.
Price is approaching a strong confluence support zone, offering a solid long opportunity.
🧩 Key Technicals
➡️ Liquidity Pool Below the Low:
There’s a visible liquidity pocke
MOVR (SPOT)BINANCE:MOVRUSDT
#MOVR/ USDT
Entry (5.000- 5.700)
***** (Wait for the price to come to the entry range & price may come to the lowest entry point ) ******
SL 4H close below 4.900
T1 7.00
T2 9.50
T3 12.00
Extra Target
T4 13.50
_______________________________________________________
Golden Ad

MOVRUSDT – Bullish Momentum Building on Daily ChartMOVRUSDT – Bullish Momentum Building on Daily Chart
The daily chart is indicating short-term upward momentum, supported by a bullish crossover of the 50-day and 200-day SMAs on the 4-hour timeframe. RSI is hovering around 74, showing strong buying pressure without being extremely overbought. MACD i

See all ideas
Summarizing what the indicators are suggesting.
Oscillators
Neutral
SellBuy
Strong sellStrong buy
Strong sellSellNeutralBuyStrong buy
Oscillators
Neutral
SellBuy
Strong sellStrong buy
Strong sellSellNeutralBuyStrong buy
Summary
Neutral
SellBuy
Strong sellStrong buy
Strong sellSellNeutralBuyStrong buy
Summary
Neutral
SellBuy
Strong sellStrong buy
Strong sellSellNeutralBuyStrong buy
Summary
Neutral
SellBuy
Strong sellStrong buy
Strong sellSellNeutralBuyStrong buy
Moving Averages
Neutral
SellBuy
Strong sellStrong buy
Strong sellSellNeutralBuyStrong buy
Moving Averages
Neutral
SellBuy
Strong sellStrong buy
Strong sellSellNeutralBuyStrong buy
Displays a symbol's price movements over previous years to identify recurring trends.