xau260125xau260125 trading plan: The boxes are identified as strong support and resistance levels. Trading within the boxes will be safer
Trade ideas

xau260125xau260125 trading plan: The boxes are identified as strong support and resistance levels. Trading within the boxes will be safer, everyone.

The close is what matter, the rest is noiseSilver making a stand versus gold early this Friday morning, refusing to let gold breakout against it.
Remember, the close is what matters, that is when the market tells you the odds shift from favoring one scenario versus another.

GOLD, Long, 8hentry: Current Market Price
take profit: 2821
stop loss: 2710
GC1! (Gold Futures) has already broken out of a triangle pattern, successfully breaking the resistance. Bullish momentum suggests further upside toward the target level at 2821.
BUY 🚀
✅ Like and subscribe to never miss a new analysis! ✅


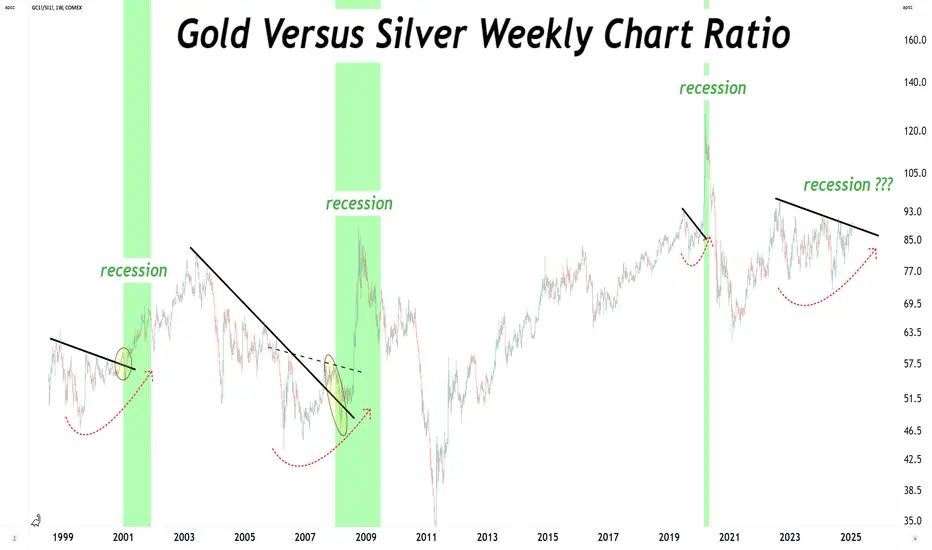
Gold vs SilverLooks like the gold versus silver ratio is making a run at that historical breakout line.
Could breakout tomorrow on the weekly chart!
No matter what we think the ratio should be at...
Be careful with GOLD !!!As you can see, the price has made a fake breakout within the triangle, which is clearly visible on the MACD showing a bearish divergence. The price might drop to around 2685 and then try to break the triangle .
Give me some energy !!
✨We spend hours finding potential opportunities and writing useful ideas, we would be happy if you support us.
Best regards CobraVanguard.💚
_ _ _ _ __ _ _ _ _ _ _ _ _ _ _ _ _ _ _ _ _ _ _ _ _ _ _ _ _ _ _ _
✅Thank you, and for more ideas, hit ❤️Like❤️ and 🌟Follow🌟!
⚠️Things can change...
The markets are always changing and even with all these signals, the market changes tend to be strong and fast!!

Gold is accepting Higher PricesLooking for the bullish action to continue. yesterday stalled out and moved sideways with no news. We do have some additional news coming today that can give us that solid breakout that we are looking for. just have to wait for the killzones.

Gold Strength Continues Ahead Of Fed MeetingThe Gold market and the metals complex as a whole had a strong run in 2024 , and Gold has seen this strength continue over the last few weeks. Since the highs in October, Gold has seen some consolidation with prices falling due to many factors such as the changing Fed environment and the overall sentiment of the precious metals complex. Some of the metals are still lagging due to the fact that metals like Silver and Copper have a more industrial background to them and have other factors impacting price movements. The average true range of Gold currently sits near 35, which is not a record high for the contract but is offering a wide daily range for traders to position themselves in.
The Gold market offers several different sizing options for many different types of traders, ranging from the newly released 1-oz contract to the full sized 100-oz contract. This wide variety of contracts helps give a larger range of traders the ability to trade depending on their own personal risk appetite or trading strategy. With the strong attention from traders on Gold along with the volatility traders have seen, it is critical for traders to understand what size contract will be most effective for their trading strategy.
If you have futures in your trading portfolio, you can check out on CME Group data plans available that suit your trading needs tradingview.com/cme/
*CME Group futures are not suitable for all investors and involve the risk of loss. Copyright © 2023 CME Group Inc.
**All examples in this report are hypothetical interpretations of situations and are used for explanation purposes only. The views in this report reflect solely those of the author and not necessarily those of CME Group or its affiliated institutions. This report and the information herein should not be considered investment advice or the results of actual market experience.

First Week of 2025 - Shape Market Sentiment for the Rest of 2025The first week of trading is always significant, as many investors begin initiating and rebalancing their positions for the year.
Last week, we discussed the bond markets, which may impact yields and influence the direction of interest rates and inflation. This could lead to increased volatility in the stock market, prompting investors to focus on gold.
1 Ounce Gold Futures
Ticker: 1OZ
Minimum fluctuation:
0.25 per troy ounce = $0.25
Micro Gold Futures & Options
Ticker: MCG
Minimum fluctuation:
0.10 per troy ounce = $1.00
Disclaimer:
• What presented here is not a recommendation, please consult your licensed broker.
• Our mission is to create lateral thinking skills for every investor and trader, knowing when to take a calculated risk with market uncertainty and a bolder risk when opportunity arises.
CME Real-time Market Data help identify trading set-ups in real-time and express my market views. If you have futures in your trading portfolio, you can check out on CME Group data plans available that suit your trading needs www.tradingview.com

100Pts Long on GOLD / 5R Multiple for DA HOUSE Recap!!COMEX:GC1!
"2025 For a greater reward, we must go to the valley to CONQUER!!" -500KTrey
Here in this video I have gone into great detail about our system;
Confluence Profile 500K (Expectational Order-Flow + PA) 20pt Stop / 5R Run... Well DONE!!
Enjoy. Stay Dedicated. Stay Focused. Seek Inspiration!!
Remember; "Our Profession is to Manage the downside costs of printing HIGHSIDE returns of $$$ consistently. Done correctly, well an Abundance of low hanging fruit awaits us." -500KTrey
+Shalom

More Higher Highs for Gold! I want to Buy Gold now and not miss the move. But the Motto is NOFOMO! We have to wait for the killzones. Asian and London session should give us a idea of what price would like to do next. We just have to wait for it!

GOLD is setting up for the week! Switched to doing my breakdown on the micro contract since is what I actually trade and the forex chart is not moving in sync with it currently so I cant trust that price action. Expecting for a set up on a major play tonight some time between Asian session and London. Price is ultimately bearish so we not looking to get in until price moves outside of value to give us a entry.

GOLD Breakout and the Impenetrable 2760 Ceiling
Market open Sunday will likely give clues as to wether gold will continue to payout into near all time highs, or reject off of 2760 again and correct back downward. If price closes above 2760, considering the upward trend close enough to the price to make a safe long entry.

Gold Looks Towards 2700 $Gold Futures Short at 2730 $ as Double Top Pattern formation completed and Neck Line is Broke successfully with retest done in H1 time frame.
Expected fall towards 2700 $ which will be Profit Taking level.
Characteristics of a Double Top Pattern:
Two Peaks:
The price creates two nearly equal highs, indicating strong resistance at that level.
The peaks are separated by a pullback (called the "valley").
Support Breakout:
The pattern is confirmed when the price breaks below the "neckline" (the horizontal line connecting the lowest point of the valley).
Volume:
Volume is typically higher during the first peak and lower during the second, showing weakening bullish momentum.
Bearish Implication:
When the neckline is broken, it suggests a potential downtrend, as buyers fail to push the price higher.

The Direction of Gold 25.01.20Hello, this is Greedy All-Day.
Today’s analysis focuses on gold.
Gold Daily Chart Analysis
Chart:
Key Observations:
Gold recently broke above its long-term descending resistance trendline.
The resistance trendline began at the high on October 31, 2024, and was broken on January 16, 2025.
After breaking the resistance, gold reached a high near 2761, which failed to break above the top of the orange supply zone.
The current resistance stands at 2759.2, below the orange zone's high of 2761.3, leading to a short-term pullback.
Support Test and Outlook:
The yellow resistance trendline has turned into support after a successful retest.
Although the orange box supply zone has not been broken, the overall bullish momentum remains intact.
Next Resistance Levels:
If 2761.3 is broken, the next resistance lies at 2772.6, the upper wick resistance level within the purple box.
Breaking above 2772.6 could open the door for a potential retest of the all-time high near 2801.8.
Long-Term Trendline and Supply Zones
Chart:
Downside Risk:
A potential short-term trend reversal requires the green box to be broken.
Current key support for a breakdown: 2666 (below this level, gold will likely fall out of the Ichimoku Cloud).
A break below the red box supply zone’s lower boundary (2595) could signal a bearish shift in the larger pennant structure.
Current Gold Levels and Trading Strategies
Chart:
Buy Strategy:
A breakout above 2761.3 is crucial for initiating a long position.
If broken, the next target is the 2772 resistance level, with further potential upside to all-time highs if 2772 is cleared.
Sell Strategy:
Focus on the range between 2729.2–2720.9 for sell signals.
For gold to return to bearish momentum, the current support trendline (yellow) must break and turn back into resistance.
If the price breaks below 2729.2–2720.9, the next support level is the red ascending trendline.
Summary
Bullish Scenario: A breakout above 2761.3 could signal continuation toward 2772.6 and beyond.
Bearish Scenario: A break below 2729.2–2720.9 could lead to a deeper correction toward the red ascending trendline or lower levels.
Stay strategic and monitor key levels carefully for potential opportunities. 🚀
