GC(XAU/USD) technical analysis and directional opinion*In this analysis I will not include macroecnomic analysis as we all know broad financial market is waiting for BoJ to create clear directional bias upcoming end of this week on Friday. However I will make a seperate post regarding "How to decode BoJ decision" on the day before the Japanese rate decision
Technical analysis on Gold futures/XAUUSD 8hour time frame
For better swing opportunity, I have done some analysis on 8hour time frame, as for me I prefer using 8hour on Gold for clearer directional evidence. As we can see in the chart, some people might ape in long position at this exact point, since it is pretty obvious Gold is trying for new ATH, yet my standpoint is a bit different. Remember the times before 2025 XAUUSD bullrun, the times when Gold was in years of indeicison phase, lots of XAUUSD traders have been forced to exit the market. Although the time frame is uncomparably smaller, considering BoJ meeting is just few days left, my opinion is to speculate the market before confirmation either macroecnomically or technically happens. So i have made two different set up on Gold one is long position and one is short position. The previous structure before recent 1.57% drop can be read in two different wave structure, one is ending diagonal(rising wedge) and one is accumulation for strong impulse(3) to the upside. As for me, I am eyeing on either side of structure to break via breakdown through the black trendline or breaking the previous liqudity point to ATH.
Some cautions
Even though we have standard of entry at this point, this is important to keep in mind, in this market where US monetary policy is not indicating clear direction but many people are awaiting for BoJ, the liquidity is extremely thin the structure can be manipulated so as for me I will wait until BoJ rate decision structure(at the moment) will break and retest either point. Also keep in mind for today's NFP, it might stimulate the liquidity temporarily and give us clear retest on either set up.
*This is not a trading advice. It is highly recommended for you to make your own decisions. God bless your account.
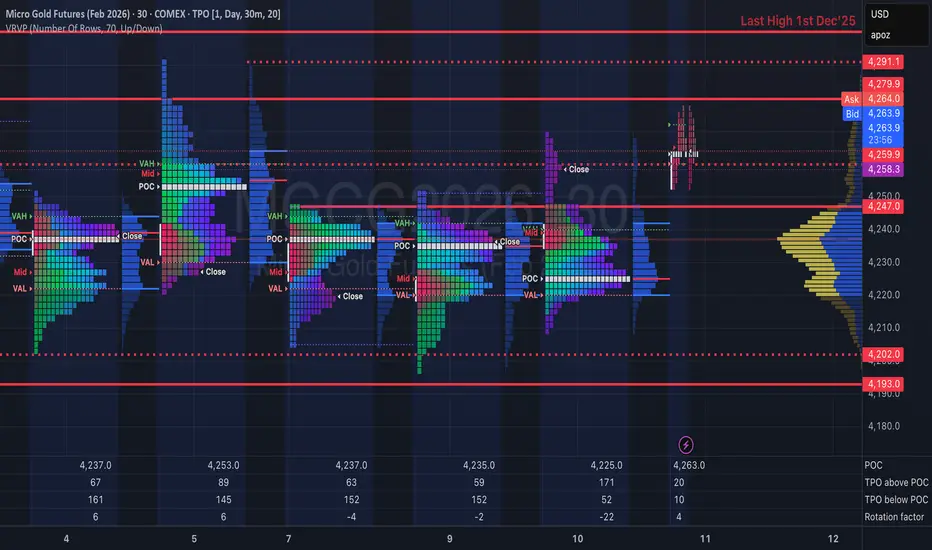
Gold Futures
No trades
Market insights

GOLD: Bullish! Buy The Dip!In this Weekly Market Forecast, we will analyze the Gold (XAUUSD) for the week of Dec. 15 - 19th.
Gold doesn't have the USD to weigh it down, thanks to the interest rate cut by the Fed. Things are looking up!
Be mindful of a short term pullback my be in the offing.... and there in lies the opportunity to long this market to a new ATH.
Enjoy!
May profits be upon you.
Leave any questions or comments in the comment section.
I appreciate any feedback from my viewers!
Like and/or subscribe if you want more accurate analysis.
Thank you so much!
Disclaimer:
I do not provide personal investment advice and I am not a qualified licensed investment advisor.
All information found here, including any ideas, opinions, views, predictions, forecasts, commentaries, suggestions, expressed or implied herein, are for informational, entertainment or educational purposes only and should not be construed as personal investment advice. While the information provided is believed to be accurate, it may include errors or inaccuracies.
I will not and cannot be held liable for any actions you take as a result of anything you read here.
Conduct your own due diligence, or consult a licensed financial advisor or broker before making any and all investment decisions. Any investments, trades, speculations, or decisions made on the basis of any information found on this channel, expressed or implied herein, are committed at your own risk, financial or otherwise.

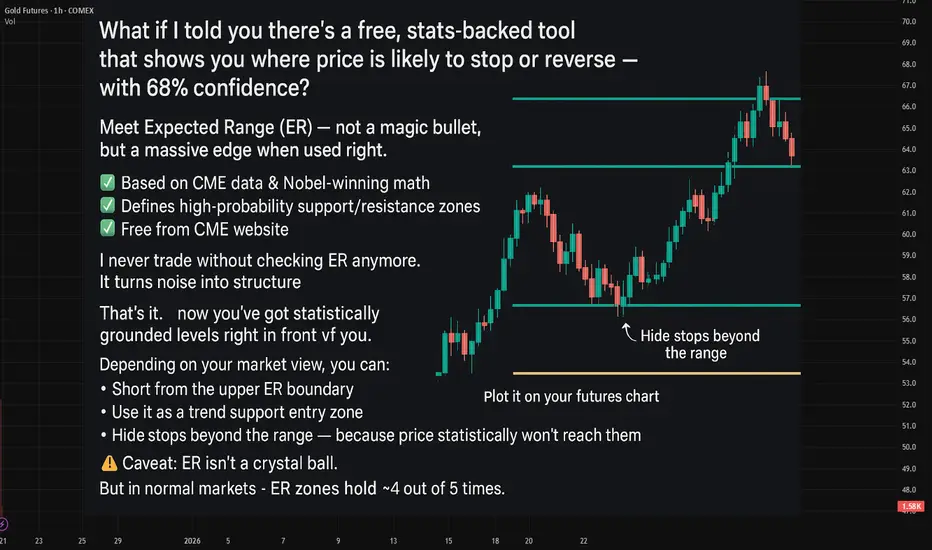
Last week Expected Ranges levels in actionQuick Recap: Last week Expected Ranges levels in action
What is Expected Range Volatility (ER)?
The Expected Range (ER) is a framework that helps traders understand how much an asset is likely to move within a specific timeframe. Based on CME market data and Nobel Prize-winning calculations, price movements within the expected volatility corridor have a 68%-95% probability of staying within those boundaries.
Crude Oil - 6 reactions to levels🔥
EUR - 4 reactions to levels
BTC - 3 reactions
GOLD - 1 reaction to levels
It's really an amazing tool to enhance your market entry💲
!!! - It doesn't guarantee trades every day.
!! it's better to combine it when working with the trend and when there's a clear sideways movement.
Gold Update 17DEC2025: Ending Diagonal Almost Done Market volatility dries up as price approaches the all-time high
Out of the three scenarios posted last time, the first one is playing out
Price is shaping an Ending Diagonal in the final wave up, which should at least retest the record high around $4,400 to complete a full five-wave sequence
Meanwhile, RSI did not build the same bullish momentum and is showing early signs of bearish divergence against price
This confirms that the current move is likely the final wave up and also warns of a possible reversal after price retests the record high
Minor support is located at the previous low around $3,901
Typically, the valley of the larger wave 4 contains the first drop in the event of a reversal
This major support is located near the $3,300 level
Let’s see how price behaves around the all-time high first

This is a follow up on yesterday's videoThis is December 17th and there have been changes in the market since that time that led to 2 bar reversals which are tools that tell us we can go long or short depending on the 2 bar reversal. We looked at it oil which I think has a good reversal here and we'll protect it with a small stop or we can wait if you don't like it don't take the trade but keep your eye on it because oil finished in ABCd pattern going lower so it may be time for it to reverse and go higher from here. And we looked at a few other markets as well.

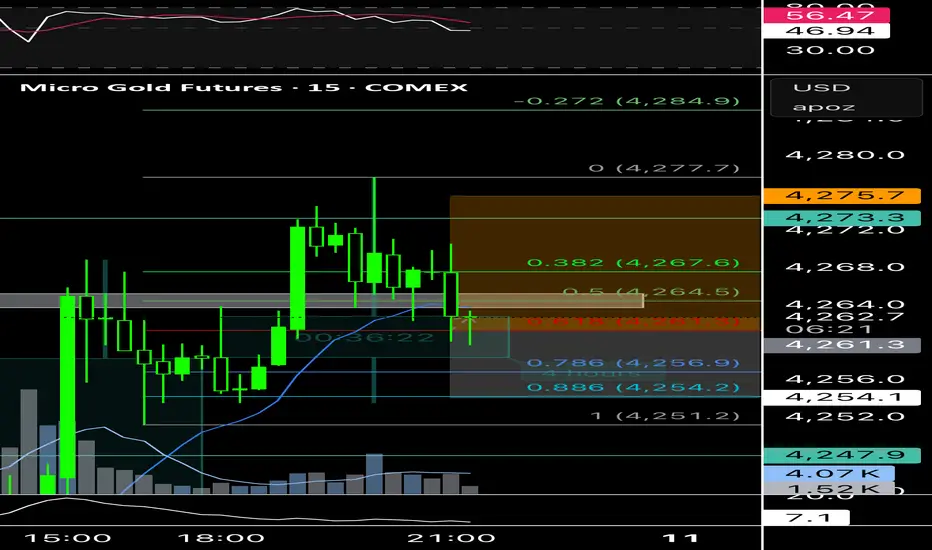
MGC Bias: Bullish (price above EMA 20/50), but no fresh impulse.
Structure: Post-trend consolidation / rotation, not expansion.
Entry: Quality pullback buy inside value; stop is structural.
Expectation: Likely rotation to prior highs; limited follow-through.
R:R fit: 1:2.5–1:3 is realistic; 1:5 requires a breakout that is not yet present.
Action: Use fixed 1:3. No partials. Consider runners only after HTF breakout with acceptance and volume expansion.

How to Trade Breakouts in TradingViewBreakout trading is a strategy that aims to capture strong price movements when markets break through key support or resistance levels, often signaling the start of a new trend or continuation move.
What You'll Learn:
Understanding breakouts as price movements beyond established support or resistance levels
How breakouts can occur at horizontal levels, trendlines, or chart patterns like triangles, rectangles, and flags
Why consolidation patterns often precede strong breakout moves
Recognizing the difference between false breakouts and confirmed breakouts
How to use candle closes beyond key levels as confirmation rather than relying on quick spikes
The critical role of volume in validating breakouts and separating real moves from fakeouts
Why expanding ATR during a breakout confirms increasing volatility and momentum
Understanding the break and close entry method for conservative breakout trades
How to scale into positions by entering partially on the break and adding on continuation
Using the pullback entry strategy to trade retests of broken levels as new support or resistance
Setting stop losses using ATR-based methods or placing them beyond consolidation patterns
Calculating profit targets with measured move techniques by projecting pattern heights
How to mark key levels in TradingView using the horizontal line tool from the left toolbar
Drawing trendlines and connecting swing points for pattern recognition
Accessing built-in pattern recognition tools through the Indicators menu
Practical examples using futures charts across multiple timeframes
This tutorial is designed for futures traders, day traders, and swing traders who want to capitalize on momentum moves and volatility expansion using technical breakout strategies.
The methods discussed may help you identify high-probability breakout setups, manage entries with proper confirmation, and set risk-appropriate stops and targets across multiple markets and timeframes.
Learn more about futures trading with TradingView: optimusfutures.com
Disclaimer
There is a substantial risk of loss in futures trading. Past performance is not indicative of future results. Please trade only with risk capital. We are not responsible for any third-party links, comments, or content shared on TradingView. Any opinions, links, or messages posted by users on TradingView do not represent our views or recommendations. Please exercise your own judgment and due diligence when engaging with any external content or user commentary.
This video represents the opinion of Optimus Futures and is intended for educational purposes only. Chart interpretations are presented solely to illustrate objective technical concepts and should not be viewed as predictive of future market behavior. In our opinion, charts are analytical tools, not forecasting instruments.

GOLDM (GOLD Mini Futures) - ABC correction done?I do mark my counts and analysis mostly on XAUUSD, because that is the tradable instrument and being used across the world.
Just for a change, I tried to plot my counts on INR GOLD Mini Futures today.
CMP: 133250
TF: 1 hour
As you can see, the corrective rise in ABC format seem to have ended at 133500 odd levels today.
The internals are marked for easy understanding.
Invalidation for this view lies at hourly close above 137500
Disclaimer: I am not a SEBI registered Analyst and this is not a trading advise. Views are personal and for educational purpose only. Please consult your Financial Advisor for any investment decisions. Please consider my views only to get a different perspective (FOR or AGAINST your views). Please don't trade FNO based on my views. If you like my analysis and learnt something from it, please give a BOOST. Feel free to express your thoughts and questions in the comments section.

long, but with very limited riskSo this is a long position trade opp, BUT, BIG BUT in here. Iam anticipating a reversal to the upside from a very tight range that might be completly wrong.
My advice, either skip gold today, or trade with very small lot size like 0.01 .

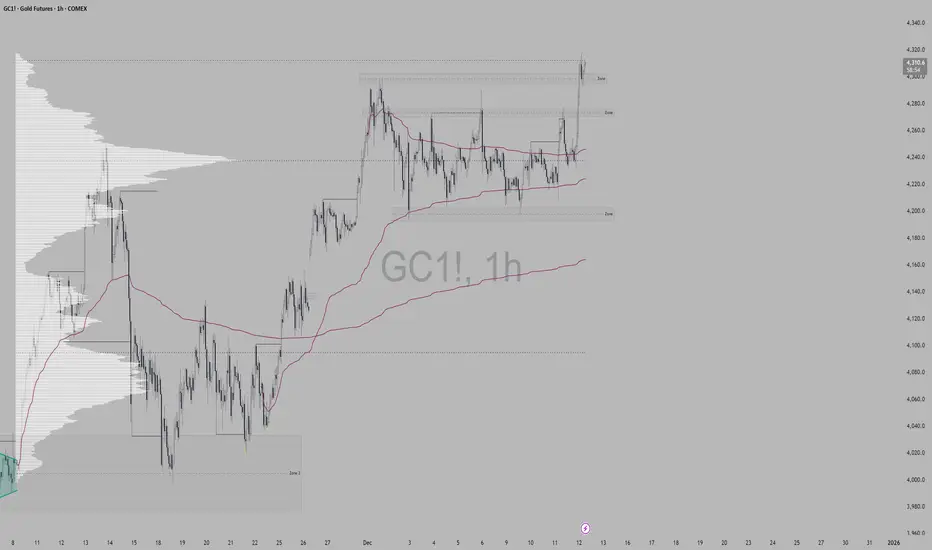
Gold Context: Strong Short Covering & The New Money TestFOREXCOM:XAUUSD COMEX_MINI:MGCG2026 COMEX:GC1!
Analysis
1. Market Context (Early US Session)
We are witnessing strong Short Covering in the early US session, continuing the momentum from yesterday where Gold traded above the previous multi-day range.
• The Driver: The vertical nature of the move confirms the exit of old shorts. However, for this to sustain, we must see this emotional energy transition into New Money Buying (Initiative) .
• Observation: If price can hold these higher levels without immediate rejection, it confirms that "New Money" is entering to defend the breakout.
2. Structure & Targets
• Bias: I remain on the Long side at this moment. The breakout above the recent balance suggests the path of least resistance is toward the higher area (ATH).
• Condition: We need to see acceptance, not just a "look and fail." Continued short covering will naturally pull the auction higher.
3. The Risk (Liquidation)
• Support Check: If the buying dries up and we see Long Liquidation , the auction will likely rotate back to test the 4300 support area. This would be a test of the breakout's validity.
Plan & Execution
• Focus: Monitoring for volume and time acceptance at these highs.
• Invalidation: Loss of momentum returning to 4300.
Talk to you for the next update. b]Analysis
1. Market Context (Early US Session)
We are witnessing strong Short Covering in the early US session, continuing the momentum from yesterday where Gold traded above the previous multi-day range.
• The Driver: The vertical nature of the move confirms the exit of old shorts. However, for this to sustain, we must see this emotional energy transition into New Money Buying (Initiative) .
• Observation: If price can hold these higher levels without immediate rejection, it confirms that "New Money" is entering to defend the breakout.
2. Structure & Targets
• Bias: I remain on the Long side at this moment. The breakout above the recent balance suggests the path of least resistance is toward the higher area (ATH).
• Condition: We need to see acceptance, not just a "look and fail." Continued short covering will naturally pull the auction higher.
3. The Risk (Liquidation)
• Support Check: If the buying dries up and we see Long Liquidation , the auction will likely rotate back to test the 4300 support area. This would be a test of the breakout's validity.
Plan & Execution
• Focus: Monitoring for volume and time acceptance at these highs.
• Invalidation: Loss of momentum returning to 4300.
Talk to you for the next update.


Gold Context: Initiative Breakout & The ATH Magnet
COMEX:GC1! COMEX_MINI:MGCG2026 FOREXCOM:XAUUSD
Analysis
1. Market Context (The Transition)
The auction has successfully transitioned. What began as mechanical Short Covering has evolved into apparent Initiative Buying .
• Structure: The market is facilitating trade at higher prices, signaling that "New Money" (Innovators/Early Adopters) sees value here.
• Momentum: This is not just emotional momentum; it is structural. The migration of value suggests confidence in the breakout.
2. The ATH Approach (Nuance Required)
With the fundamental backdrop updated (Policy Divergence/Fed Pause) and year-end flows active, the auction is magnetically drawn to the All-Time High .
• The Probability: The path of least resistance is higher. We are likely to test the ATH limits soon.
• The Caution (Laggards): As we press into record highs, be aware of the "Diffusion of Information." We want to ensure the buying remains dominated by smart money, not Laggards chasing the move late. If the buying quality deteriorates (low volume breakouts), expect a sharp inventory adjustment.
Plan & Execution
• Bias: Long/Constructive.
• Invalidation: We need to hold acceptance above the recent breakout shelf (4300 area). A failure to hold would suggest the current participants were just "renting" the position, not owning it.
Talk to you for the next update.

GOLD (XAUUSD): bullish-Neutral! Prepare To Buy!In this Weekly Market Forecast, we will analyze the Gold (XAUUSD) for the week of Dec. 8 - 15th.
Gold closed last week indecisive. It has been moving sideways inside a bullish FVG, that continues to act as support.
Prepare for a short term pullback.... and buy it.
Mindful that FOMC is Wednesday, and the USD is weakened with the expectation of a .25 rate cut.
Enjoy!
May profits be upon you.
Leave any questions or comments in the comment section.
I appreciate any feedback from my viewers!
Like and/or subscribe if you want more accurate analysis.
Thank you so much!
Disclaimer:
I do not provide personal investment advice and I am not a qualified licensed investment advisor.
All information found here, including any ideas, opinions, views, predictions, forecasts, commentaries, suggestions, expressed or implied herein, are for informational, entertainment or educational purposes only and should not be construed as personal investment advice. While the information provided is believed to be accurate, it may include errors or inaccuracies.
I will not and cannot be held liable for any actions you take as a result of anything you read here.
Conduct your own due diligence, or consult a licensed financial advisor or broker before making any and all investment decisions. Any investments, trades, speculations, or decisions made on the basis of any information found on this channel, expressed or implied herein, are committed at your own risk, financial or otherwise.

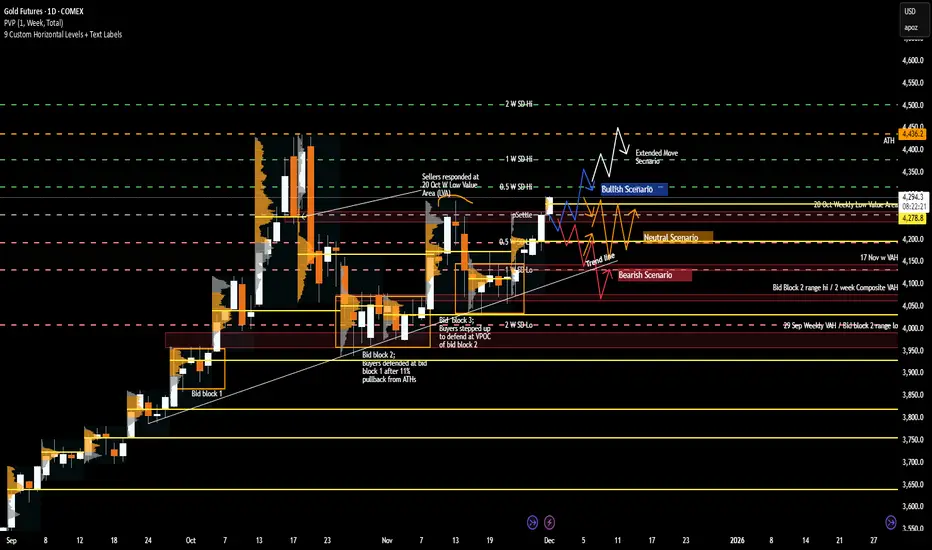
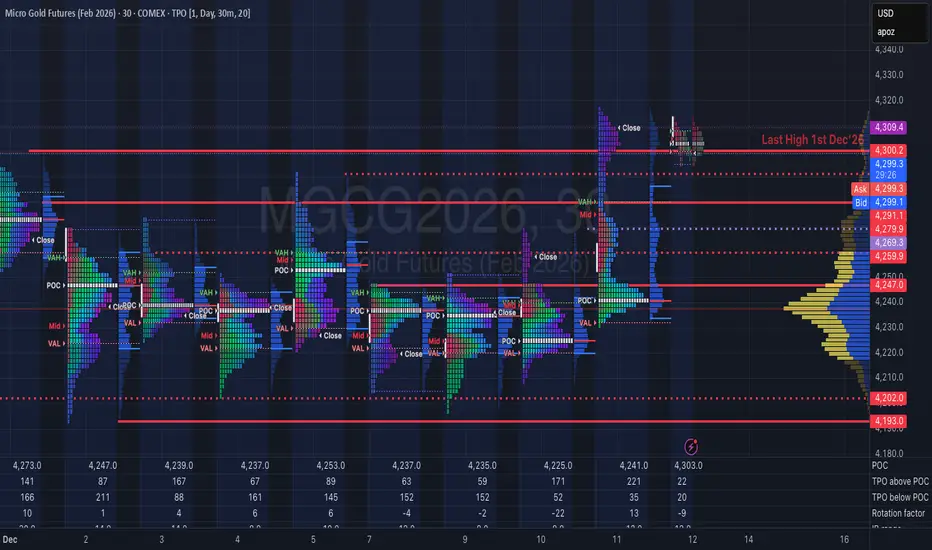
Gold Weekly Playbook: Key Levels, Scenarios & Sentiment Triggers1. Macro Update
Gold continues to trade within a macro environment defined by shifting rate expectations and evolving recession probabilities. With the Fed maintaining a data-dependent stance, the market remains highly sensitive to inflation and employment prints. Cooling inflation supports the case for rate cuts, pulling real yields lower and creating a constructive backdrop for gold.
Conversely, stubborn inflation pushes the narrative toward “higher for longer,” often slowing upside momentum and encouraging more rotational price action. This doesn’t immediately turn GC bearish, but it does cap impulsive continuation as traders reassess forward guidance.
Recession sentiment is the second major driver. Rising recession odds tend to benefit gold as investors rotate into safe-haven assets, even without imminent Fed easing. A persistent soft-landing narrative—stable labor markets, steady consumption—can reduce defensive flows and temper gold’s velocity. Overall, the macro backdrop remains cautiously supportive, but still very catalyst-driven.
2. What Has the Market Done?
Gold has exhibited constructive price action, with the recent week imbalancing up and out of the 17 Nov weekly balance/value area. Importantly, the market closed at the highs of the week, signaling sustained buyer aggression and broad acceptance of higher prices.
Weekly value and Volume point of Control (VPOC) have shifted upward, reinforcing a meaningful change in participant behavior: buyers are willing to transact at progressively higher prices, and sellers have not shown the ability to force price back into prior balance. This upward migration of value marks a firm shift in short-term sentiment.
The market is also now at an important structural zone at 4251.3—the 13 Oct weekly VPOC and the 20 Oct weekly Low value area (LVA). How the market reacts at this level—rejecting, stalling, or accepting—will be a telling indicator of whether buyers maintain control or whether sellers can slow the advance.
3. What to Expect in the Coming Week
The key level to watch this week:
4254.9 - Previous week/month’s settlement price
This level acts as a major pivot for directional conviction. Holding above settlement supports the case for continuation; a sustained move below it increases the likelihood of rotation or deeper testing.
Bullish Scenario
If the market holds and accepts above 4254.9, upside continuation becomes likely.
Target 1: 4378.6 (Weekly 1 Standard Deviation (SD) High) – expect responsive sellers.
If market accepts above 4378.6:
Target 2: 4436.2 (ATH region) – extended bullish objective.
Bearish Scenario
If the market fails to hold above 4254.9, expect sellers to target 4195.3 (previous week’s VPOC).
Additional downside triggers:
If buyers cannot reclaim 4261.3 (previous week’s high), pressure may push price through prior value toward 4136.5.
If buyers then fail to reclaim back above 4195.3:
Next target: 4131.2 (Weekly 1 SD Low / 17 Nov VPOC / Bid Block 3 midpoint).
Continued seller control may extend the move toward 4070/80, aligned with the 2-week composite VAH and upper boundary of Bid Block 2.
Neutral Scenario
If neither buyers nor sellers show conviction, expect two-way consolidation around previous week’s settlement, 4254.9, between 4316.7 and 4193.1 (10 Nov weekly high / 20 Oct LVA / weekly 0.5 SD high).
This remains the most probable balance zone unless a macro catalyst drives breakout behavior.
This week’s structure is clean: one major pivot and clearly defined pathways for both sides. Whether GC breaks out or slips back into rotation will hinge on how price behaves around 4254.9.
What’s your outlook for Gold this week? Drop a comment and give this post a boost so more traders in the community can join the discussion!
Disclaimer: This is for educational purposes only and not financial advice. Always trade your own plan with proper risk management.
Gold trending or mean revertingTrading near the upper zone may indicate a potential reversal or pullback toward efficiency levels.
Gold Context: Initiative Buying & The Path to ATHCOMEX:GC1! COMEX_MINI:MGCG2026 FOREXCOM:XAUUSD
Analysis
1. Market Context (Transition to Initiative) The Gold auction has evolved significantly. What began as mechanical short covering has transitioned into probable initiative buying (New Money).
Structure: The auction is facilitating trade at higher prices, indicating that buyers are aggressive and willing to pay up.
The Shift: We have moved away from the "emotional" phase into a more sustainable value migration. The market is now seeking to repair the structure and test the extremes.
2. The Road to ATH (4425) We are now within striking distance of the All-Time High (4425 area) .
Key Reference (4300): This level has shifted from a psychological barrier to a potential support shelf.
The Setup: If Gold can hold and build acceptance above 4300 , it confirms the breakout. We expect the auction to establish a new balance area here before making the final rotation toward the ATH.
Friday Flows: Be mindful of weekend profit-taking, but as long as the structure holds above the breakout point, the medium-term bias remains firmly to the upside.
Plan & Execution
Focus: Watch for acceptance above 4300.
Scenario: If we see a pullback, I am monitoring for responsive buyers to defend the breakout zone (turning old resistance into support).
Talk to you for the next update.
Multi Top - Multi Bottom. Go Next Your Golden Shift4200 for a potential reload (supply area). 4300 (b/throgh) - to take it more bag.

GC daily trade plan for Dec 10, 2025Gold is in the consolidation range. Market is awaiting FOMC meeting. I do not expect any big moves ahead of that meeting however I will watch for trade signals at the extremes of that consolidation

Gold continuation underway?On a 4 hour time frame, looking like we potentially completed a reacc model.
Price potentially continuing to retest and blow through highs.
Will be looking for entries on day trades in the green highlighted area if we start to squeeze.
Ultimate target will be the 1.61 fib of the range. (I use fibs as targets when we are running blue skies.
I will want to see us riding the 10EMA on the hour, entries will be made on the 1 min on flag breakouts while above and riding the 10EMA on the 1 min.

Gold. This is what the opportunity setup looked like.Gold.
This is what the opportunity setup looked like way back in August of 2023.
Price was $1922. Now $4226. Over 120% higher.
There is no such opportunity now.

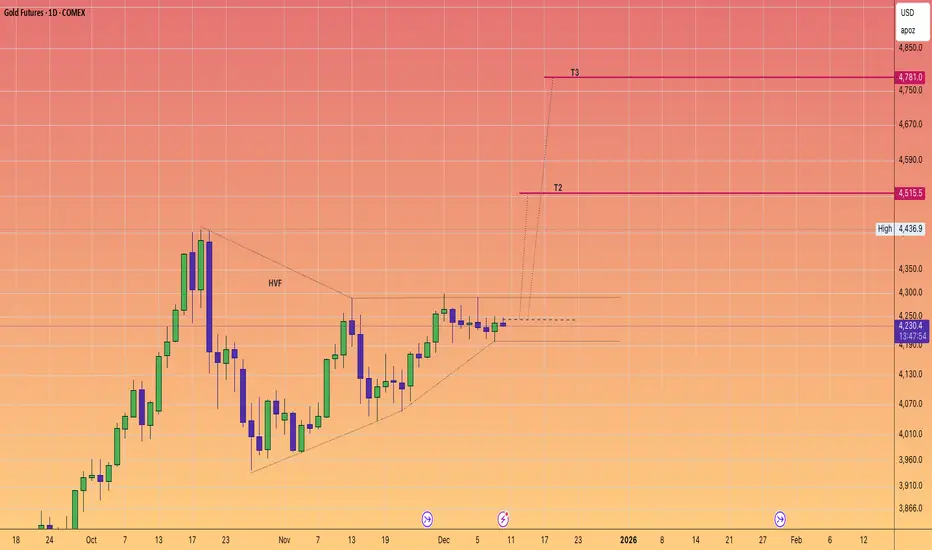
GOLD in a windup. Targets $4800AS we progress ever closer to the quite historic level of $5k for #GOLD
We note that Gold has been quite predictable and routinely has delivered +20% powerful moves since 2024.
The price action currently suggests we are about have another pop very soon.
Will it be enough to tag the $5K level
odds suggest that it definitely on the table.
The #HVF pattern points to $4800 and with some over performance we are right on that doorstep.
Post-FOMC Context: Policy Divergence & Inventory AdjustmentCOMEX:GC1! FOREXCOM:XAUUSD COMEX_MINI:MGCG2026
Analysis
1. Macro Context (The Currency Auction)
The structural bid for the USD remains valid due to clear Policy Divergence .
* The Fed: The "Hawkish Cut" (25bps) coupled with the signal for a "slower pace" (only one cut projected for 2026) confirms a pivot to a "pause" to verify data.
* The ECB: Conversely, Europe is cutting into economic weakness.
* Implication: This widening rate spread creates a fundamental floor. The recent drop in DXY displays the characteristics of a Liquidation Break (inventory adjustment) rather than a structural reversal. The market flushed weak, crowded longs, but value has not migrated lower.
2. Gold Auction Analysis (Emotional Structure)
The post-FOMC rally in Gold displays the hallmarks of an Emotional Trade .
* Structure: The vertical move has left behind Low Volume Nodes (LVNs) and single prints. This indicates the auction was driven by mechanical short covering rather than initiative buying, leaving a "poor" or "thin" structure.
* The Test: We are trading into Higher Time Frame (HTF) resistance.
* Scenario A: For a credible attempt at ATH, we require New Money (OTF) to step in and backfill these LVNs—converting the thin structure into accepted value.
* Scenario B: Without sustained OTF participation, the probability favors a rotation back to value to repair the poor structure. Emotional rallies often fade once the short covering inventory is depleted.
3. ES Context (Liquidity Window)
The "Hawkish" pause signal removes the "easy money" narrative for 2026. If 10Y yields break higher, the ES auction is vulnerable to its own liquidation break as participants adjust to the new rate path.
Plan & Execution
* Gold: Caution on the long side at these highs. The structure is fragile. Monitoring for a fade back to value versus genuine acceptance.
* DXY: Expect two-way trade as the liquidation stabilizes and inventory balances.
Talk to you for the next update.