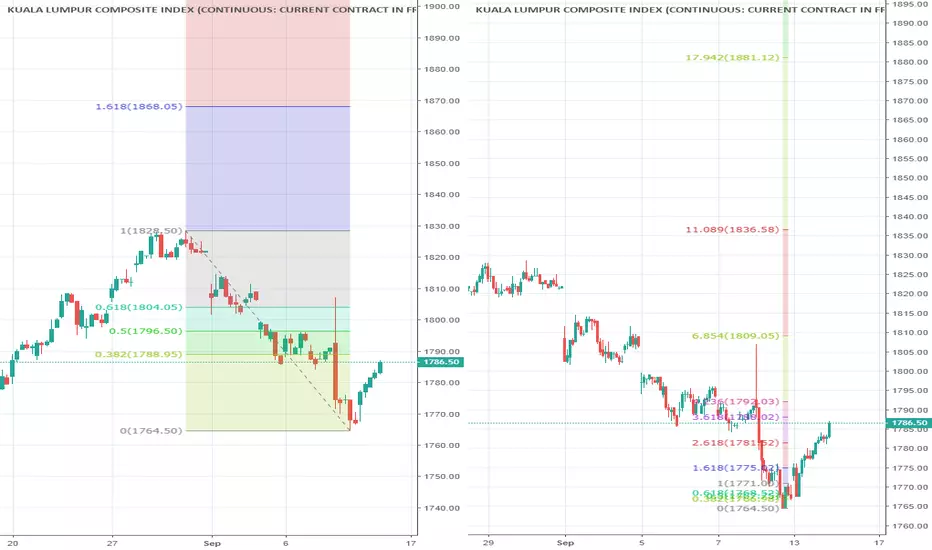
FKLI - Potential retracement to SellIn Daily chart (left chart), current price did not breakup 1804, this suggest the market remain in correction zone while bias to the downside. The current rally will be reverse if price trade below 1793.5. With Dow trading near 1% below Friday 17:15, FKLI likely to open gap down.
Stay Tune for price projection after first swing has formed. Trader please watch out following price level for potential support resistance & price indication:
Resistance : 1800 & 1804
Support : 1792 & 1785
FTSE Bursa Malaysia KLCI Futures
No trades
Trade ideas

FKLI - Rebound ContinueOn yesterday post, crucial support 1767.5 have prove valid by price action, as rebound breakup correction zone 1776.5 to 1784, the rebound will be a stronger one.
Price should approach 1789 to 1804 zone in short term. 1792 will be resistance.
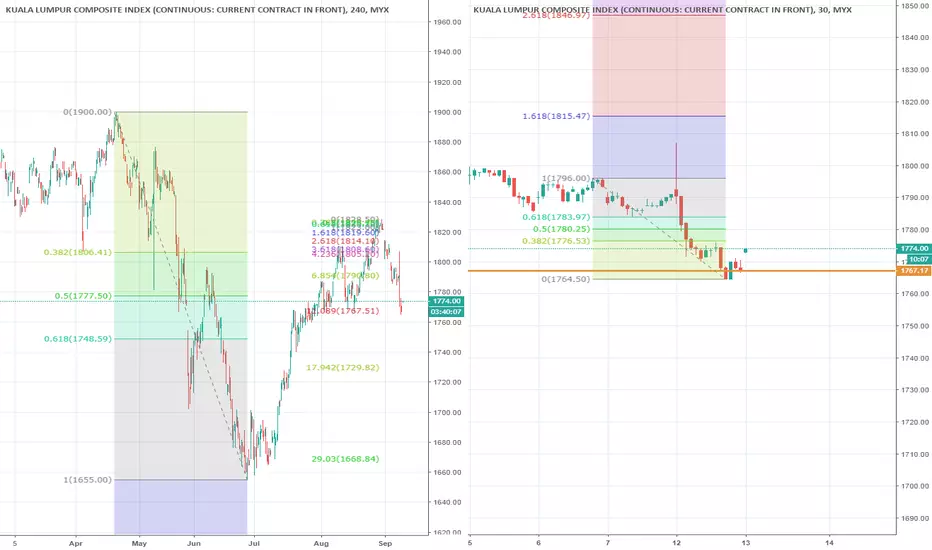
FKLI - Crucial Support 1767.5FKLI correction come to crucial support level (see left chart arrows), trader please monitor this price level for clues of direction, below 1767.5 will see market continue selling to 1729.5 As higher timeframe suggest on the left side, the market trading in correction phase.
If market rebound from 1767.5, the resistance to be see between 1776.5 to 1774. Price further this range indicate a stronger rebound.
FKLI - Sideway around 1790.5FKLI have not moving our from range 1785 - 1796 since 5 Sep. In the daily chart, this price zone was crucial support at 61.8% of previous impulsive swing. In FBM KLCI chart, price did not breakaway the 61.8% (1794). Expecting FKLI to continue sideway until breakout from the range. While without higher high set up, the entire picture remain bearish.

FKLI - Below 1790.5, next target at 1767.5The selling remain with emerging market bearish sentiment remain. Trader please look for sell opportunity.

FKLI back to Correction and heading to 1790Almost the same set up we see in Crude oil, FKLI failed to sustain 1806. Price likely to trade lower and heading to 1790.


FKLI potential downtrend?A break and close below the 1,770 could spark a sustained selling pressure for FKLI.
Tradingview: tradingview.go2cloud.org

Is FKLI losing momentum?FKLI for the time being is losing momentum towards the upside as long as prices below the green color trendline.
As traders, had you prepared for this potential outcome?

Short FKLIThe futures kuala lumpur index start weakening from 1850 to 1820 base on weekly chart.
short around 1850 will test the level 1820.
