FCPO Week 43 2025: Consolidation or bearish to 4300?Happy Deepavali!
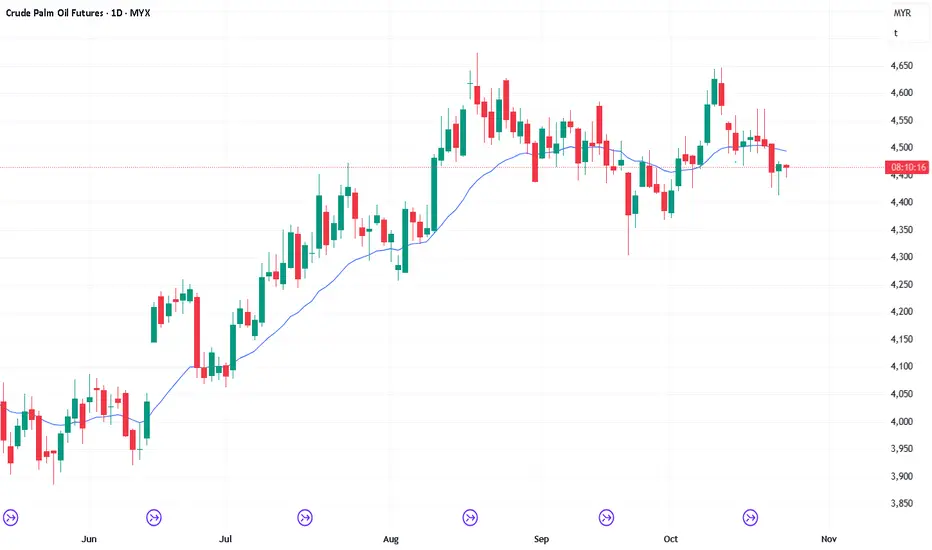
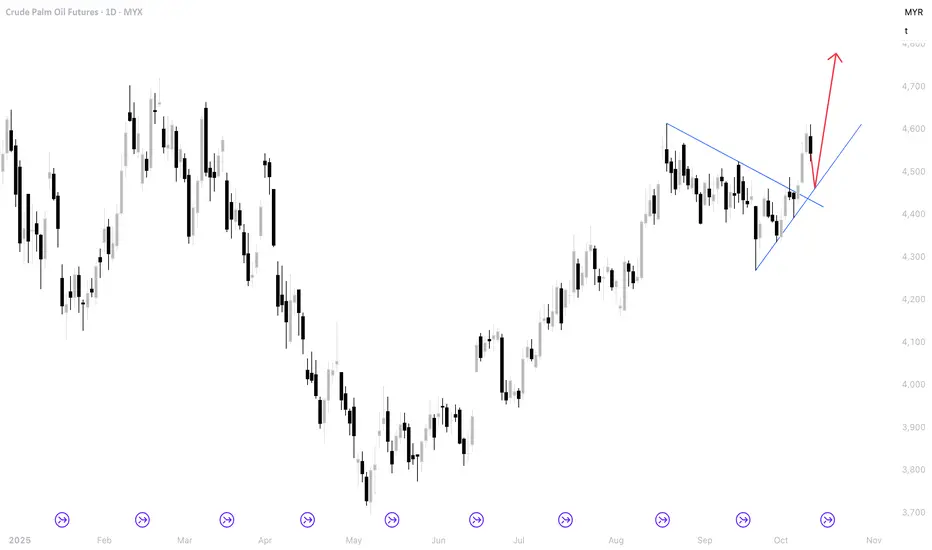
Price has shifted from bullish to a potential bearish. Momentum to go higher has been greatly reduced. A key reversal created on Friday could be the Lower High for a bearish move.
There is a potential of double top. Still early since it is yet to confirm. If price can break and clos
Related commodities

24/5/25 Will The Weekly Candlestick Close Bearish or Neutral?
Thursday’s candlestick (Oct 23) was a bull bar closing near its high with a long tail below and trading below the 20-day EMA.
In our last report, we said traders would observe whether the bears could create follow-through selling below the 20-day EMA, or if the market would trade slightly lower
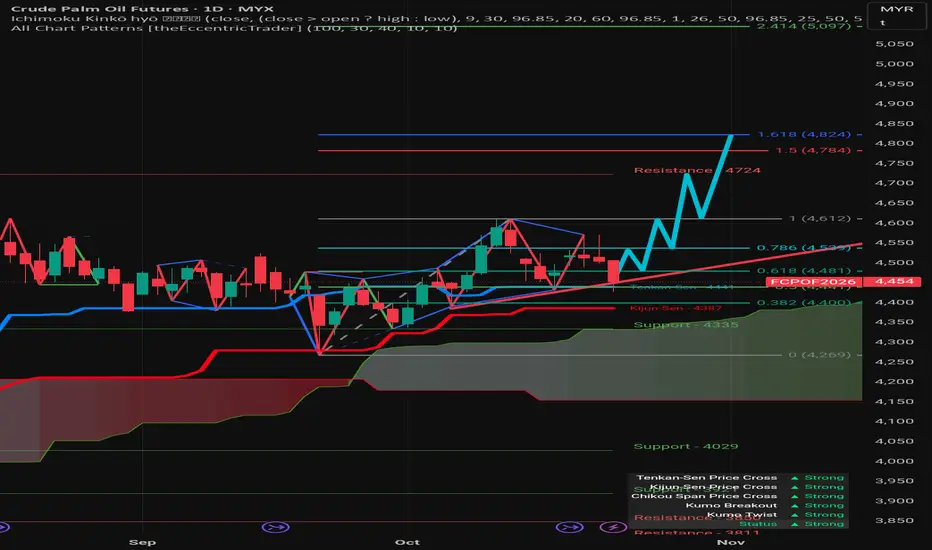
Strong bullish environmentTenkan-Sen (Conversion Line - Blue): 4,441
Kijun-Sen (Base Line - Red): 4,287
Kumo (Cloud): The shaded area that acts as a dynamic support/resistance zone. The current price is trading above the upper edge of the cloud (Senkou Span A/B), which is generally bullish.
Chikou Span (Lagging Span - Gre
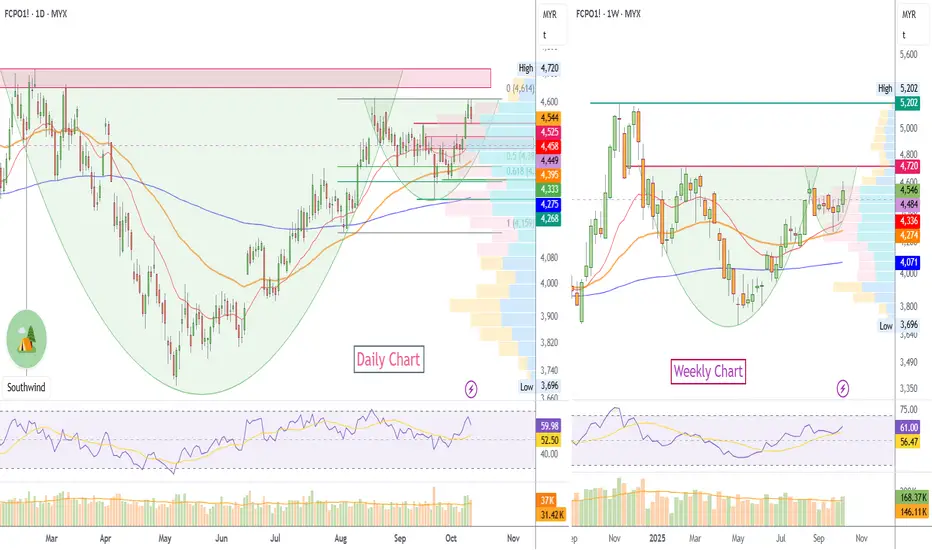
Weekly Roundup: FCPO as of October 10, 2025Weekly Roundup: FCPO as of October 10, 2025
Market Stance & Technical Bias
Stance: Bullish, based on a valid cup and handle formation evident across both daily and weekly timeframes.
Confidence Level: High for bullish continuation upon confirmation; medium until a decisive breakout is observed.
17/10/25 Can Bull Create Strong FT Buying or Fail to Do So?
Thursday’s candlestick (Oct 16) was another doji trading around the 20-day EMA.
In our last report, we stated that traders would observe whether the bulls could create a retest of the October 9 high in the next few days, even if it only forms a lower high, or if the bears would be able to creat
23/10/25 Bears Need FT Selling Below 20-Day EMA
Wednesday’s candlestick (Oct 22) was a bear bar closing in its lower half and closing below the 20-day EMA.
In our last report, we stated that traders would observe whether the bears could create follow-through selling below the 20-day EMA or if the 20-day EMA would continue to act as support,

FCPO Week 42 2025: Bullish to 4700?Does price ready for the upside? It looks bullish at the moment. However there might be a retracement coming. A retracement to about 4460-4470 area should create another movement higher.
Happy trading and good luck.
16/10/25 Currently Sideways Around 20-Day EMA
Wednesday’s candlestick (Oct 15) was an inside doji with prominent tails.
In our last report, we stated that traders would observe whether the bulls could create a retest of the October 9 high in the next few days, even if it only forms a lower high, or if the bears would be able to create follow-

22/10/25 Bears Need FT Selling Below 20-Day EMA
Tuesday’s candlestick (Oct 22) was a bear doji closing near its low with a long tail above and closing around the 20-day EMA.
In our last report, we stated that traders would watch to see if the bears could create follow-through selling below the 20-day EMA, and if the 20-day EMA would continue

21/10/25 Can The Bears Create FT Selling Below 20-Day EMA?
Friday’s candlestick (Oct 17) was a bear doji closing in its lower half with a long tail above and closing above the 20-day EMA.
In our last report, we said traders would watch if bulls could create a strong bull bar, closing the weekly candlestick with a bull body. Or, if bears could create a

See all ideas
Summarizing what the indicators are suggesting.
Neutral
SellBuy
Strong sellStrong buy
Strong sellSellNeutralBuyStrong buy
Neutral
SellBuy
Strong sellStrong buy
Strong sellSellNeutralBuyStrong buy
Neutral
SellBuy
Strong sellStrong buy
Strong sellSellNeutralBuyStrong buy
A representation of what an asset is worth today and what the market thinks it will be worth in the future.
Displays a symbol's price movements over previous years to identify recurring trends.
Frequently Asked Questions
The current price of Crude Palm Kernel Oil Futures is 7,774 MYR / TNE — it hasn't changed in the past 24 hours. Watch Crude Palm Kernel Oil Futures price in more detail on the chart.
Track more important stats on the Crude Palm Kernel Oil Futures chart.
The nearest expiration date for Crude Palm Kernel Oil Futures is Jul 15, 2026.
Traders prefer to sell futures contracts when they've already made money on the investment, but still have plenty of time left before the expiration date. Thus, many consider it a good option to sell Crude Palm Kernel Oil Futures before Jul 15, 2026.
Open interest is the number of contracts held by traders in active positions — they're not closed or expired. For Crude Palm Kernel Oil Futures this number is 0.00. You can use it to track a prevailing market trend and adjust your own strategy: declining open interest for Crude Palm Kernel Oil Futures shows that traders are closing their positions, which means a weakening trend.
Buying or selling futures contracts depends on many factors: season, underlying commodity, your own trading strategy. So mostly it's up to you, but if you look for some certain calculations to take into account, you can study technical analysis for Crude Palm Kernel Oil Futures. Today its technical rating is neutral, but remember that market conditions change all the time, so it's always crucial to do your own research. See more of Crude Palm Kernel Oil Futures technicals for a more comprehensive analysis.