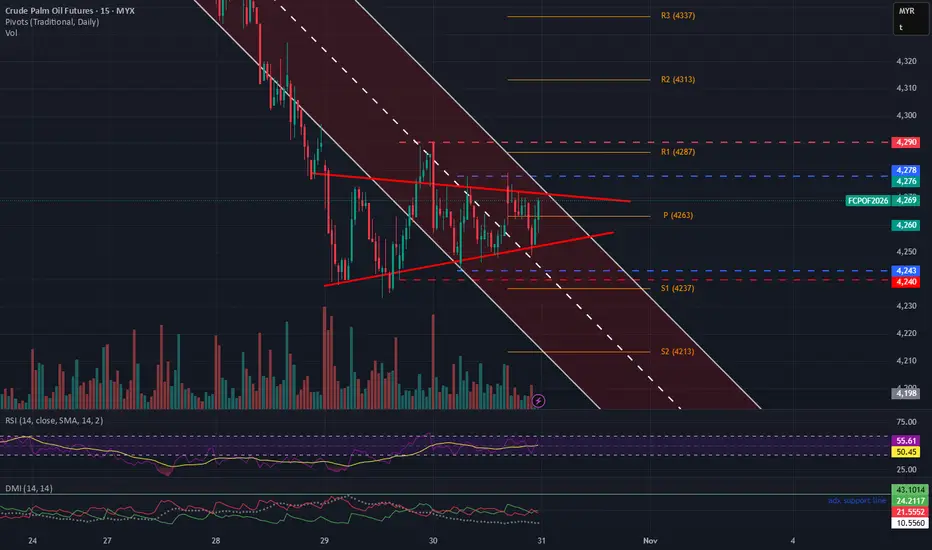
FCPO Forming a symmetrical triangle Main Trend: Bearish
Short Term Trend : Sideways
Trading Plan:
• Short –
o If price unable to break above 4272. TP1=4255 TP24237 TP3=4213
SL=4280
o If price gap up but fail to break above 4287. TP1=4272 TP2=4255 SL=4290
• Long –
o If price break above 4272. TP1=4287 TP2=4313 SL=4263
o If price gap
Related commodities
CPO JAN Futures Double top PatternCPO Jan futures forming double top chart pattern. Prices are trading well below the rising trend line at 4350. Trading below 4350 prices are expected to trade further lower to test 4200 - 4100 range in near term. If price falls further below 4100 then we might witness prices to test 3950 - 3800 leve

FCPO Week 45 2025: Retrace or consolidation to continue bearish.Bearish overall. However there is a sign of bearish exhaustion.Price making swing lows but the momentum has declined thus signalling that price might retrace before resuming lower. However looking at 15m chart this retracement is not started yet. Still no higher low or higher high yet. Monday sessio

Strong downtrend, price has broken below several support levels.The price is well below the Kumo (cloud), which is a strong bearish signal.
The Kijun-Sen (Base Line) is at 4,405 and the Tenkan-Sen (Conversion Line) is below it, suggesting bearish momentum.
The Chikou Span (Lagging Span) is below the price from 26 periods ago, confirming the bearish trend.
The

4/11/25 Can The Bulls Create a Minor PB to 20-Day EMA?
Yesterday’s candlestick (Monday, Nov 3) was a follow-through bear bar closing near its low with a small tail below.
In our previous report, we noted that traders would watch whether the bulls could produce a minor pullback and a few decent bull bars in the days ahead, or if the bears would exte

3/11/25 - Nov Likely to Trade at Least a Little Lower
Friday’s candlestick (Oct 31) was a bear bar closing near its low.
In our previous report, we noted that the bulls wanted a strong bull bar to form a weekly candlestick with a long tail below, reducing the week’s bearishness. Conversely, the bears wanted a strong bear bar to confirm control and

30/10/25 First Pullback Would Likely Only Be Minor
Yesterday's candlestick (Wednesday, October 29) was another bear bar closing near its low with a small tail below.
In our last report, we said traders would observe whether the bears could create more follow-through selling, or if the bulls could create a pullback instead.
The bears continue to cr
Declining Palm Oil Prices : CSE - WATA/AGAL/NAMU/etcFundamentals
Malaysian palm oil futures have entered a corrective phase, plunging to a four-week low with an 8% decline over the period. This price softening is primarily attributed to:
• Demand contraction in key export markets
• Appreciation of the Malaysian ringgit, reducing competitiveness

27/10/25 Bears Want FT Selling, Bulls Want PB to 20-Day EMA
Friday’s candlestick (Oct 24) was an inside bear bar closing near its low and still trading below the 20-day EMA.
In our last report, we stated that traders observe whether the bears can create a bear bar closing near their low. If they get that, the weekly candlestick will close near its low,

24/5/25 Will The Weekly Candlestick Close Bearish or Neutral?
Thursday’s candlestick (Oct 23) was a bull bar closing near its high with a long tail below and trading below the 20-day EMA.
In our last report, we said traders would observe whether the bears could create follow-through selling below the 20-day EMA, or if the market would trade slightly lower
See all ideas
Summarizing what the indicators are suggesting.
Neutral
SellBuy
Strong sellStrong buy
Strong sellSellNeutralBuyStrong buy
Neutral
SellBuy
Strong sellStrong buy
Strong sellSellNeutralBuyStrong buy
Neutral
SellBuy
Strong sellStrong buy
Strong sellSellNeutralBuyStrong buy
A representation of what an asset is worth today and what the market thinks it will be worth in the future.
Displays a symbol's price movements over previous years to identify recurring trends.
Frequently Asked Questions
The current price of Crude Palm Kernel Oil Futures is 7,774 MYR / TNE — it hasn't changed in the past 24 hours. Watch Crude Palm Kernel Oil Futures price in more detail on the chart.
Track more important stats on the Crude Palm Kernel Oil Futures chart.
The nearest expiration date for Crude Palm Kernel Oil Futures is Sep 15, 2026.
Traders prefer to sell futures contracts when they've already made money on the investment, but still have plenty of time left before the expiration date. Thus, many consider it a good option to sell Crude Palm Kernel Oil Futures before Sep 15, 2026.
Open interest is the number of contracts held by traders in active positions — they're not closed or expired. For Crude Palm Kernel Oil Futures this number is 0.00. You can use it to track a prevailing market trend and adjust your own strategy: declining open interest for Crude Palm Kernel Oil Futures shows that traders are closing their positions, which means a weakening trend.
Buying or selling futures contracts depends on many factors: season, underlying commodity, your own trading strategy. So mostly it's up to you, but if you look for some certain calculations to take into account, you can study technical analysis for Crude Palm Kernel Oil Futures. Today its technical rating is sell, but remember that market conditions change all the time, so it's always crucial to do your own research. See more of Crude Palm Kernel Oil Futures technicals for a more comprehensive analysis.