Defying Gravity: MYX’s $6B FDV While BTC NukesMYX price action is doing that magical thing where it pretends nothing happened while BTC casually nukes 14% in a day. Totally normal. Very organic. Definitely not suspicious at all.
We’re supposed to believe a token drifting sideways under a multi-month descending trendline deserves an almost 6 bi
Related pairs

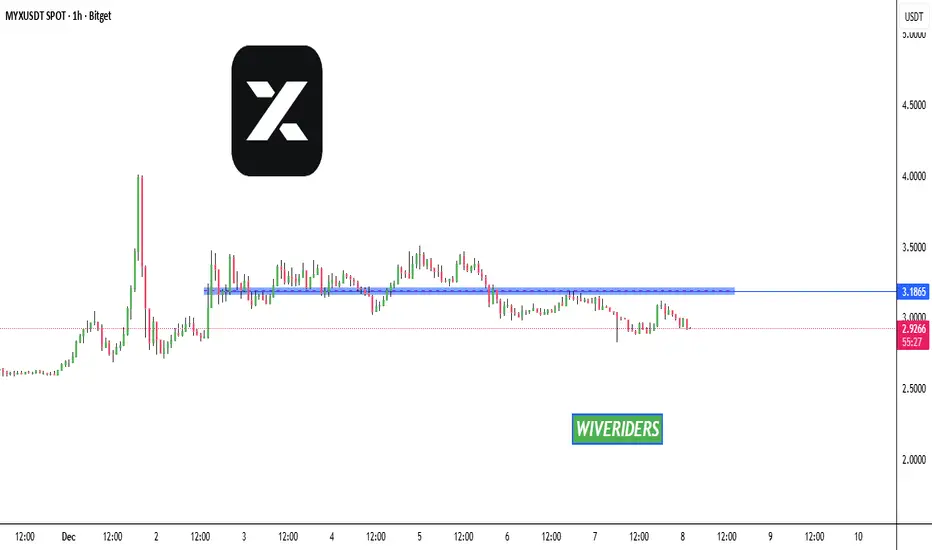
MYX PERPETUAL TRADE SELL SETUP Short from $5.06MYX PERPETUAL TRADE
SELL SETUP
Short from $5.06
Currently $5.03
Targeting $4.92 or Down
(Trading plan IF MYX
go up to $5.38 will add more shorts)
Follow the notes for updates
In the event of an early exit,
this analysis will be updated.
Its not a Financial advice

MYX Analysis (1D)From the point where we placed the red arrow on the chart, the MYX correction has begun.
The corrective phase is either an ABC pattern or a more complex structure. We are currently in Wave B of this phase. Wave B itself is an ABC, where Wave B of B formed a triangle that has now completed, and the

MYXUSDT Bounce from Major Demand Zone – Bull Reversal Loading?Traders, eyes on MYXUSDT.P! 📈
After a steep downtrend from highs, price has finally hit the key order block demand zone (green area ~4.80-5.16) on the daily/weekly structure.
We saw a classic liquidity sweep below (red zone ~4.56), trapping sellers, followed by a strong bullish candle reversal – th

MYX Finance Explosive Breakout. Momentum Expansion After Range RMYX has completed a clear range resolution after weeks of consolidation, breaking decisively above the former resistance around the 4.00 area. The breakout triggered a strong momentum expansion, pushing price rapidly into the 6.00–7.00 zone with elevated volatility and volume.
This type of vertical

Bearish Flag Forming — Potential Continuation to the DownsidePrice action suggests a bearish flag is forming after a sharp impulsive move down. The current rising channel looks corrective rather than impulsive, which is typical behavior before continuation to the downside.
This asset shows classic pump & dump characteristics: a fast vertical pump, follow

Deep corrections are expected for MYX (12H)The MYX token has risen without supportive market structure and mainly through spike-driven moves. After a major bearish CH and the formation of a liquidity pool above the chart, it is now prone to further corrections.
It is expected to move from the supply zone toward the target levels marked on t

MYXTrying to think that, MYX it is going to get heated up again, somedays now i am monitoring it and the buy volume it is increasing, who knows, lets see if we could reach the 1st and second target marked on the chart....
good luck and god bless you all
this is not a financial advice,
DYOR

MYX is testing the red resistance zone again🚨📊 MYX Update
MYX is testing the red resistance zone again 🔴.
If a breakout occurs, the first target will be the green line level 🟩🎯.

MYX has broken below the blue support level 🚨📊 MYX Update
MYX has broken below the blue support level 🔵⬇,
showing sellers are taking control of the move.
This breakdown increases the chance of further downside
unless buyers quickly reclaim this zone.
See all ideas
Summarizing what the indicators are suggesting.
Oscillators
Neutral
SellBuy
Strong sellStrong buy
Strong sellSellNeutralBuyStrong buy
Oscillators
Neutral
SellBuy
Strong sellStrong buy
Strong sellSellNeutralBuyStrong buy
Summary
Neutral
SellBuy
Strong sellStrong buy
Strong sellSellNeutralBuyStrong buy
Summary
Neutral
SellBuy
Strong sellStrong buy
Strong sellSellNeutralBuyStrong buy
Summary
Neutral
SellBuy
Strong sellStrong buy
Strong sellSellNeutralBuyStrong buy
Moving Averages
Neutral
SellBuy
Strong sellStrong buy
Strong sellSellNeutralBuyStrong buy
Moving Averages
Neutral
SellBuy
Strong sellStrong buy
Strong sellSellNeutralBuyStrong buy
Displays a symbol's price movements over previous years to identify recurring trends.
Frequently Asked Questions
The current price of MYX Finance / USDT (MYX) is 6.30114 USDT — it has fallen −2.95% in the past 24 hours. Try placing this info into the context by checking out what coins are also gaining and losing at the moment and seeing MYX price chart.
MYX Finance / USDT price has risen by 18.07% over the last week, its month performance shows a 22.50% increase, and as for the last year, MYX Finance / USDT has increased by 7.31 K%. See more dynamics on MYX price chart.
Keep track of coins' changes with our Crypto Coins Heatmap.
Keep track of coins' changes with our Crypto Coins Heatmap.
MYX Finance / USDT (MYX) reached its highest price on Sep 11, 2025 — it amounted to 19.98000 USDT. Find more insights on the MYX price chart.
See the list of crypto gainers and choose what best fits your strategy.
See the list of crypto gainers and choose what best fits your strategy.
MYX Finance / USDT (MYX) reached the lowest price of 0.04668 USDT on Jun 19, 2025. View more MYX Finance / USDT dynamics on the price chart.
See the list of crypto losers to find unexpected opportunities.
See the list of crypto losers to find unexpected opportunities.
The safest choice when buying MYX is to go to a well-known crypto exchange. Some of the popular names are Binance, Coinbase, Kraken. But you'll have to find a reliable broker and create an account first. You can trade MYX right from TradingView charts — just choose a broker and connect to your account.
Crypto markets are famous for their volatility, so one should study all the available stats before adding crypto assets to their portfolio. Very often it's technical analysis that comes in handy. We prepared technical ratings for MYX Finance / USDT (MYX): today its technical analysis shows the buy signal, and according to the 1 week rating MYX shows the buy signal. And you'd better dig deeper and study 1 month rating too — it's strong buy. Find inspiration in MYX Finance / USDT trading ideas and keep track of what's moving crypto markets with our crypto news feed.
MYX Finance / USDT (MYX) is just as reliable as any other crypto asset — this corner of the world market is highly volatile. Today, for instance, MYX Finance / USDT is estimated as 7.65% volatile. The only thing it means is that you must prepare and examine all available information before making a decision. And if you're not sure about MYX Finance / USDT, you can find more inspiration in our curated watchlists.
You can discuss MYX Finance / USDT (MYX) with other users in our public chats, Minds or in the comments to Ideas.