MyxPrice has broken out before and got heavily rejected, and again retested same spot.
Stochastic is already showing weakness
Rsi already showing bearish weakness and macd confirm the buying pressure weak.
Short Entry
Entry 1
16.37
17.3
17.9
Stop loss 18.2
Tp
16.3
15.9
15.3
15

MYX - WHOLE BOTTOM? LSE:MYX
looks inreresting here; it looks like a whole bottom, with a possible bullish accumulation 📈
If i'm rigt, big green dildo could join the party! 🚀

WARNING ON MYX!! 🚨 WARNING ON #MYX 🚨
TOP COULD BE IN, IT LOOKS LIKE FALSE MOVE AND PRICE MANIPULATION!
HIGHLY OVERBUY MOVE & ICHIMOKU chart does not looks safe for bulls!
A big sell pressure could entering the game soon, resulting in a -20%+ correction move!
KEY RESISTANCE & SELL ZONE FOR WHALES around 18.00


MYX – Technical Outlook and Key Market InsightsDescription:
MYX has recently shown increased attention within the market due to its potential growth in both trading activity and investor interest. From a fundamental perspective, MYX is positioned in the *, where demand is supported by rising adoption and long-term sector expansion.
This analy

MYX — From Vertical Madness to Reality CheckWhat goes vertical… usually retraces. MYX pulled the ultimate degen squeeze: from under $2 to $19 in days. Now we’re sitting at ~$10–11, bleeding lower on footprint, funding, and CVD.
This is the dangerous part of the chart — where early buyers think they “caught the bottom,” but the data screams d

The down after the liquidity generationAll the information are on thee title and on the graph.
The only thing i will add is, keep your leverage low on this one, and take your profit.
First goal : 9.111

Same Setup, Bigger Boom Incoming?The price action here is telling a clear story. Every time LSE:MYX spends time moving sideways, quietly accumulating in a range, it eventually launches into a powerful breakout. We can see it happened once, then again — each consolidation phase built up energy, and when that energy released, the m

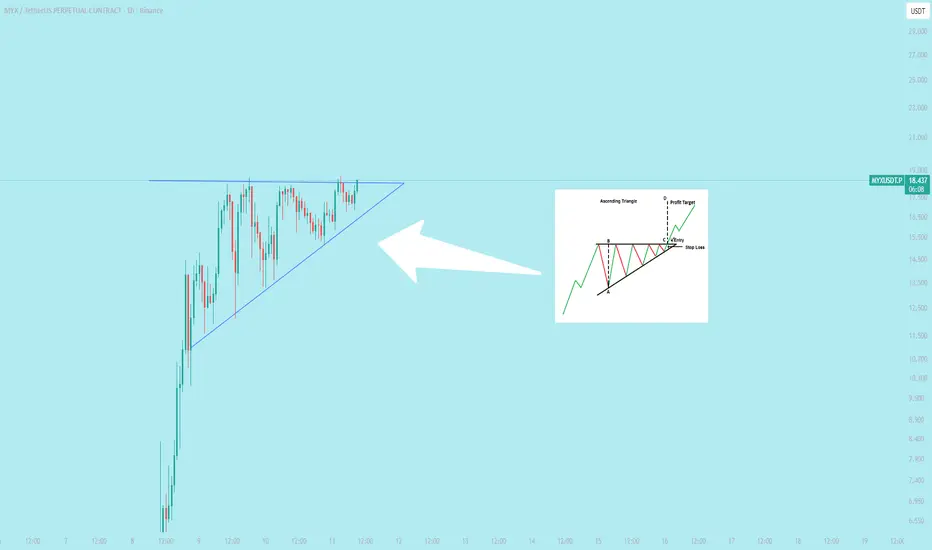
$MYX Performing Ascending Triangle Chart PatternsHow to Trade an Ascending Triangle
Here’s how traders can approach a stock that’s forming an ascending triangle pattern.
Step 1: Identify the Pattern Formation
To find an ascending triangle pattern, look for a stock that had a strong uptrend and is now trading sideways. A horizontal area of resista
We’ve seen this before… $LUNA, $OM next MYX Right now, the entire feed is screaming about CRYPTOCAP:MYX — but let me remind you:
We’ve already been here with VIE:LUNA , with NASDAQ:OM , and the charts speak for themselves.
💥 Explosive gains — tens of thousands of %
📉 Then a brutal crash — 90%+ down
All of it happens at peak hype, when i

See all ideas
Summarizing what the indicators are suggesting.
Oscillators
Neutral
SellBuy
Strong sellStrong buy
Strong sellSellNeutralBuyStrong buy
Oscillators
Neutral
SellBuy
Strong sellStrong buy
Strong sellSellNeutralBuyStrong buy
Summary
Neutral
SellBuy
Strong sellStrong buy
Strong sellSellNeutralBuyStrong buy
Summary
Neutral
SellBuy
Strong sellStrong buy
Strong sellSellNeutralBuyStrong buy
Summary
Neutral
SellBuy
Strong sellStrong buy
Strong sellSellNeutralBuyStrong buy
Moving Averages
Neutral
SellBuy
Strong sellStrong buy
Strong sellSellNeutralBuyStrong buy
Moving Averages
Neutral
SellBuy
Strong sellStrong buy
Strong sellSellNeutralBuyStrong buy