Buy Idea – ARM Holdings (ARM)Buy Idea – ARM Holdings (ARM)
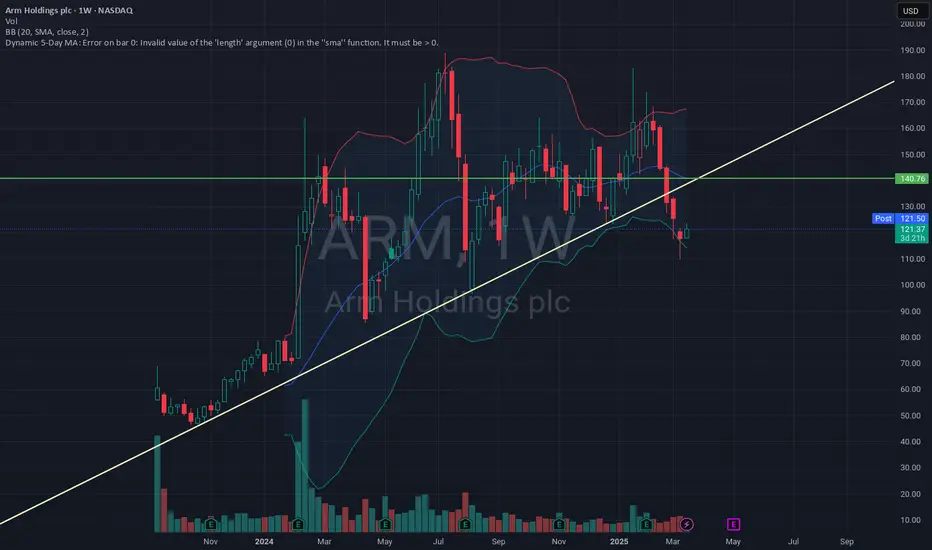
• Current price: $131.73
• First target: $135
• Second target: $140
• Stop loss: $128
The stock is trading sideways but is close to a support level at $128. If the price holds above $130 and trading volume picks up, it could move toward the next targets. ARM is a well-known company in chip design used in smartphones and other devices.
Plan: Consider buying gradually at current levels, targeting a medium-term rise.
Trade ideas

ARM eyes on $134.08: Semi-Major Genesis fib for High Support? ARM recovering well from last earnings dump.
Now struggling against a Semi-Major Genesis fib.
Look for a higher high or retest of fib for entry.


Arm - Positive outlook ahead of earnings - Value to collect?Hi guys we would be looking into our analysis for ARM Holdings before their earnings call!
ARM Holdings (ARM) – Positive Outlook Ahead of Earnings
ARM Holdings plc, a leading provider of semiconductor intellectual property, is poised to deliver a strong earnings report, driven by robust demand for its advanced chip architectures, continued growth in AI and data center markets, and deepening strategic partnerships across the tech ecosystem. As we approach the upcoming earnings announcement, several key factors support a bullish thesis on ARM's stock.
1. Strong Market Position and Licensing Growth
ARM continues to dominate the RISC-based processor architecture market, with its designs powering over 99% of smartphones and making significant inroads into the computing and server space. The company's royalty and licensing model provides a resilient revenue base, which has historically performed well even during industry slowdowns. Recent licensing agreements with leading tech companies, including NVIDIA, Apple, and Amazon, signal continued reliance on ARM's technology.
In Q1 2025, analysts expect double-digit year-over-year growth in licensing revenue, reflecting heightened demand for ARMv9 architecture, which powers next-generation AI and machine learning workloads. This growth is being further fueled by increased adoption in automotive and IoT sectors.
2. AI and Data Center Tailwinds
The surge in AI demand is transforming the semiconductor landscape. ARM's energy-efficient designs are increasingly being integrated into AI accelerators, edge devices, and cloud data centers. The company's Neoverse platform has been gaining traction, especially as hyperscalers seek alternatives to x86 architectures for power- and cost-efficiency. Amazon Web Services’ Graviton processors, based on ARM, are a prominent example of this trend.
As AI infrastructure spending accelerates globally, ARM stands to benefit significantly. Positive forward guidance around AI-related royalties and design wins would further validate this tailwind in the upcoming earnings report.
3. Financial Strength and Margin Expansion
Analysts anticipate revenue growth of 20-25% YoY in the upcoming report, accompanied by improved gross and operating margins. ARM’s high-margin royalty revenue stream contributes significantly to profitability, and recent cost controls have enhanced operational efficiency.
The IPO in 2023 provided a strong capital base, enabling increased R&D investment while maintaining financial flexibility. Shareholder sentiment has been buoyed by ARM's prudent capital allocation and expanding free cash flow profile.
4. Ecosystem Momentum and Strategic Partnerships
ARM’s ecosystem-first approach—collaborating with chipmakers, software developers, and system integrators—has become a key competitive advantage. The company's recent partnerships in the automotive and industrial sectors highlight growing non-smartphone revenue streams. Additionally, ARM is collaborating closely with AI chip startups and hyperscalers, reinforcing its central role in the evolving semiconductor landscape.
Investors should also watch for updates on ARM’s role in emerging verticals such as AR/VR, smart cities, and secure edge computing, all of which could significantly boost its long-term growth narrative.
5. Technical and Sentiment Indicators
From a technical standpoint, ARM stock has shown resilience, trading above key moving averages and gaining momentum in recent weeks. Options activity suggests bullish sentiment, with increased call buying ahead of earnings. If the company delivers a beat-and-raise quarter, it could catalyze a breakout to new highs.
📌 Trade Plan
📈 Entry: 121
✅ Target: 144 Below the strong resistance
❌ SL: 95 - Above the strong support

ARM stock: long-term potentialIs the recent decline an opportunity for massive upward potential? 💡
ARM stock holds strong long-term potential, as evident from past price movements. Recent quarterly data suggests the stock has been oversold, creating a possible setup for a rebound. To regain momentum, the stock needs to maintain key support between the 86 and 95 range.

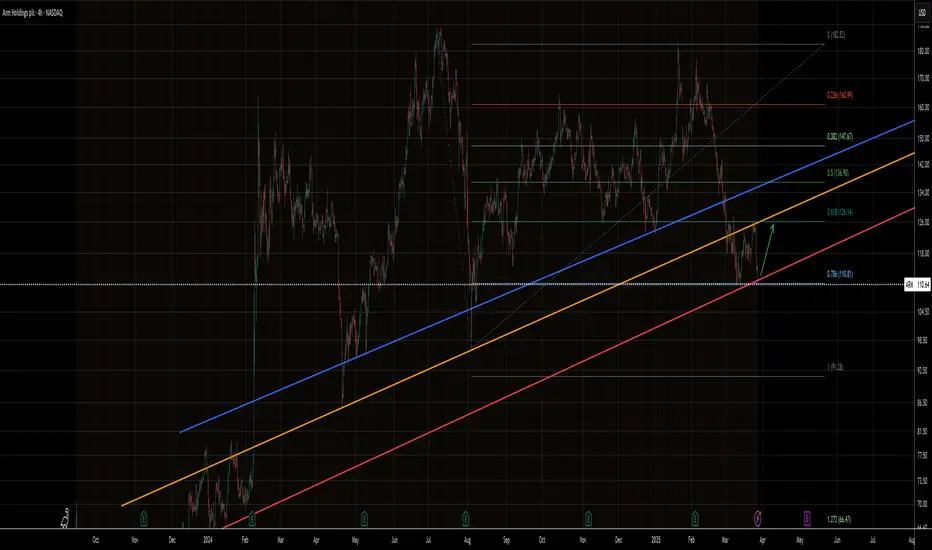
ARM wants to test the 0.6 off the trend line bounceNFA, this is my personal strategy. Looking to the 0.6 for the bounce with a tight SL
130+ Fibonacci resistance zone indicators curving With oscillators curving favorably, Fibonacci confirmed, and MACD turning in favor that triggers other indicators, this is on the high road to potentially 130 and beyond.


Arm Holdings LONGBullish Gartley
ARM Arm Holdings
As always, an idea that needs further multiple confirmations.

ARM Short x 2Entered at 149.15 selling short, felt curious, wanting to learn the mechanics of short selling. Placed trade in ETrade. Buy to cover price $156.36. Using a 2 touch point trendline break. Entered on 30 min TF.

$ARM - Mid $130s Price TargetA major Ascending Triangle is forming, looks like price action may continue trending within the triangle. Price Target near term heading to the mid $130s at the bottom of the ascending triangle.

A support at 155 before breakoutStill moving, so I will have more room to run before it comes down, looking for a start at 162.


ARM - Great AI, Great Financials,formulating Ascending ChannelHi guys we would be looking into ARM Holdings - some fundamentals below
Arm Holdings plc (ARM) has demonstrated impressive financial performance, driven by its strategic positioning in the rapidly expanding artificial intelligence (AI) sector. The company's energy-efficient chip designs have become integral to AI applications, leading to significant revenue growth and increased market valuation.
In the fiscal year ending March 31, 2024, Arm reported a 47% year-over-year increase in revenue, reaching $928 million for the fourth quarter. This surge was primarily due to record-high royalty revenues, with the latest Armv9 technology contributing around 20% of these royalties.
Analysts have recognized Arm's strong market position. Raymond James initiated coverage with an "overweight" rating and a price target of $160, citing Arm's significant role in generative AI and its robust ecosystem.
Similarly, Wells Fargo set a price target of $155, highlighting the transition to Arm's latest technology as a key revenue driver.
Arm's inclusion in the PHLX Semiconductor Sector Index reflects its growing prominence in the semiconductor industry. The company's American depositary receipts have surged approximately 150% since its Nasdaq debut, underscoring investor confidence in its growth trajectory.
Overall, Arm's strategic focus on AI and its innovative chip designs have positioned the company for sustained financial success, making it an attractive consideration for investors seeking exposure to the burgeoning AI market.
Technicals - We have formulated a great Ascending Channel, which is looking to capitalize on great earnings which is due to tomorrow -
Entry: 155
Target: 180 - The Target is just below the strong resistance level which is around 190 mark.

Inverted H+S ? Watching this downtrend on the hourly charts, and can see a potential inverted head and shoulders pattern forming, if so it could be enough for a breakout. Tomorrow could be a volatile day with the interest rate decision and with Powell speaking.


ARM Explodes Higher! Is There More Upside Ahead? Jan. 23Technical Analysis (TA) for Trading:
1. Trend Analysis:
* ARM has recently broken out of a consolidation phase and is in a strong uptrend on the hourly chart.
* The price surged past resistance at $150 and is currently testing the $180 level.
* A rising wedge pattern suggests possible consolidation or a pullback.
2. Key Levels:
* Resistance: $182.88 (recent high), $185 (psychological resistance).
* Support: $175 (key intraday support), $160 (previous breakout level).
3. Indicators:
* MACD: Bullish momentum but showing signs of weakening. Watch for a potential crossover for reversal signals.
* Stochastic RSI: Overbought, signaling potential short-term profit-taking or consolidation.
4. Volume:
* Strong breakout volume indicates bullish interest, but declining volume near $180 suggests weakening momentum.
5. Outlook:
* Bullish above $175 with potential retests of $185 or higher.
* Bearish if $175 breaks; watch for a pullback toward $160.
GEX Analysis for Options Trading:
1. Gamma Exposure (GEX):
* Highest Positive NETGEX: $160, acting as strong support.
* CALL Walls: $175 (68.93% GEX7) and $180 (78.79% GEX8), significant resistance zones.
2. Options Flow:
* IVR: 24.8, indicating low implied volatility relative to the past year.
* IVx Avg: 81, slightly elevated, suggesting a moderately bullish sentiment.
* CALL Activity: 73.2%, heavily skewed toward bullish positioning.
3. Trading Strategy:
* Bullish Setup:
* Buy Calls: $180 Strike (expiring 1-2 weeks).
* Entry: Near $175 support.
* Target: $185-$190.
* Stop-Loss: Below $170.
* Bearish Setup:
* Buy Puts: $170 Strike (expiring 1-2 weeks).
* Entry: Near $182 resistance.
* Target: $160.
* Stop-Loss: Above $185.
Actionable Suggestions:
* Monitor $175 for bullish continuation or breakdown signals.
* If momentum weakens, consider short-term profit-taking or protective puts.
* Options traders should focus on strikes aligned with GEX levels ($175 CALLs or $170 PUTs).
Disclaimer: This analysis is for educational purposes only and does not constitute financial advice. Always do your own research and manage risk effectively.


1/3/25 - $arm - don't get sucked in at $1401/3/25 :: VROCKSTAR :: NASDAQ:ARM
don't get sucked in at $140
- those of you who follow know my preference in semis is NYSE:TSM , NASDAQ:NVDA , NASDAQ:AVGO (and there are some alts that i'm willing to entertain)
- but why pay 80x PE for 20-25% PE growth when you could pay 35x for NASDAQ:NVDA at 40% CAGR EPS or 20x PE for NYSE:TSM growing 30%+ (and probably understated). it's not like NASDAQ:ARM is some new kid worth 5 bn or 10 bn cap. they're $150 bn mkt cap.
- this move today is a positioning one, look across the mkts. and when you add king dawgs NASDAQ:NVDA and NYSE:TSM are having blow out days this NASDAQ:ARM pit gets dragged along.
- given NYSE:TSM reports in 2 weeks, i've traded some of my '27 calls for some lighter fluid ST calls and i'm using NASDAQ:ARM as a hedge b/c if semis are weak next week (not anticipating this - i'm actually expecting a few more days of run), i expect NYSE:TSM ST calls to more than offset my NASDAQ:ARM P's. and if semi's r down, NASDAQ:ARM will give a lot of this move back and i can reposition back into NYSE:TSM longer-dated calls (and still think i make money on the ST spread).
- anyway. in '25... i'd not be caught holding this bag. you've been warned, but alas i'll probably get some grief for this lol. just call em like i see em. off to a good start this year with the picks, but playing defense still w a lot of cash as i've monetized some NASDAQ:NXT , NYSE:UBER , NYSE:TSM and NASDAQ:NVDA as of the last 2 days.
have a good weekend.
V

Coming close to turning even at 119-120 waiting for a fewIndicators to confirm, like the MACD below 0, otherwise at the oversold level, the flow of money index looks like a good variable level to start to reverse, and the support area makes the bounce more likely. Could it happen now? Yes, but that support line could also act as the first support line; however, as Bollinger and Keltner confirm, the second support, which would mean the upper teens to twenty, could be a play, so we are bullish as of now or close to it.

ARM ARM – Technical Pattern: Symmetrical Triangle
The stock is moving within a symmetrical triangle, with lower highs and higher lows. A breakout to the upside could lead to a target of $180-$190, while a breakdown would target support around $120. A recommended stop is at $135.
This is not a recommendation to buy or sell, just an opinion.

ARM $210?Flag and pole pattern is trying to break and according to fib levels, Elliot wave theory suggest great buying option at point (2)
Accumulate more at (4)
Sell all at (5),
Wait for the correction and It may move up exponential as It's competitor INTEL is Failing in a Very bullish semiconductor market.
