CRISPR breaking free? CRISPR Therapeutics
Short Term
We look to Buy a break of 73.10 (stop at 68.66)
Further upside is expected and we look to set longs in early trade. The trend of higher lows is located at 60.50. Previous resistance, now becomes support at 73.00. A higher correction is expected.
Our profit targets will be 82.99 and 94.00
Resistance: 83.00 / 96.00 / 135.00
Support: 73.00 / 60.50 / 43.00
Disclaimer – Saxo Bank Group. Please be reminded – you alone are responsible for your trading – both gains and losses. There is a very high degree of risk involved in trading. The technical analysis, like any and all indicators, strategies, columns, articles and other features accessible on/though this site (including those from Signal Centre) are for informational purposes only and should not be construed as investment advice by you. Such technical analysis are believed to be obtained from sources believed to be reliable, but not warrant their respective completeness or accuracy, or warrant any results from the use of the information. Your use of the technical analysis, as would also your use of any and all mentioned indicators, strategies, columns, articles and all other features, is entirely at your own risk and it is your sole responsibility to evaluate the accuracy, completeness and usefulness (including suitability) of the information. You should assess the risk of any trade with your financial adviser and make your own independent decision(s) regarding any tradable products which may be the subject matter of the technical analysis or any of the said indicators, strategies, columns, articles and all other features.
Please also be reminded that if despite the above, any of the said technical analysis (or any of the said indicators, strategies, columns, articles and other features accessible on/through this site) is found to be advisory or a recommendation; and not merely informational in nature, the same is in any event provided with the intention of being for general circulation and availability only. As such it is not intended to and does not form part of any offer or recommendation directed at you specifically, or have any regard to the investment objectives, financial situation or needs of yourself or any other specific person. Before committing to a trade or investment therefore, please seek advice from a financial or other professional adviser regarding the suitability of the product for you and (where available) read the relevant product offer/description documents, including the risk disclosures. If you do not wish to seek such financial advice, please still exercise your mind and consider carefully whether the product is suitable for you because you alone remain responsible for your trading – both gains and losses.
CRSP trade ideas

WATCH $CRSPBullish
Fundamental
- Positive P/FCF
- Decent earnings
- Decent accumulation
TA
- Falling wedge formation
- Price above POC level
- Price under major S/R level

CRISPR Therapeutics is a buy for Cathie Wood! CRISPR Therapeutics is a favourite of star stock buyer Cathie Wood. It’s up 27% over the past month. Will this strength last and should I be adding it to my portfolio?
CRISPR Therapeutics (NASDAQ:CRSP) is a Swiss–American biotechnology company headquartered in Zug that uses gene therapy to correct genetic mutations to treat and cure diseases. CRISPR refers to the technology used by the firm, which itself is an acronym for “clustered regularly interspaced short palindromic repeats”. It’s considered more efficient than other gene altering technologies.
The stock is down a whopping 45% over the past 12 months. But that’s not entirely surprising. Speculative growth stocks like CRISPR Therapeutics aren’t exactly in vogue. Moreover, government and regulators around the world are being particularly cautious when it comes to gene therapy treatments.
However, there’s plenty of reason to be optimistic about CRISPR Therapeutics’ future. And clearly Cathie Wood thinks the same. The star stock picker, and CEO of Ark Invest (NYSEMKT:ARKK), has repeatedly bought CRISPR Therapeutics stock for the Ark portfolio over the past fortnight. And that might be the reason why this stock has outperformed the NASDAQ over the past month. The index is down 6.4% over the past 30 days. Meanwhile, CRISPR Therapeutics has soared, up 27.7%.
Financials and balance sheet
CRISPR Therapeutics annual revenue for 2021 was $915m, a 127154.94% increase from 2020. This substantial rise year-over-year is primarily due to collaboration revenues from Vertex Pharmaceuticals (NASDAQ:VRTX).
The vast majority of this revenue came in Q2 and in relation to the development of CTX001 — an investigational ex-vivo CRISPR gene-edited therapy for treating sickle cell disease (SCD) and transfusion-dependent beta thalassemia (TDT). Vertex made a $900 million upfront payment to CRISPR Therapeutics in June 2021 after amending their arrangement over CTX001. In Q4, CRSPR Therapeutics received $12.3 million from Vertex after the firm reached a research milestone in the Myotonic Dystrophy Type 1 (DM1) programme.
CRISPR Therapeutics is solely dependent on Vertex Pharmaceuticals for collaboration revenues. The rise in revenue was reflected by a turnaround in profitability. The firm reported gross profits of $476m in 2021, up from a loss of $266m in 2020.
Operating expense have increased year-on-year, reaching $102m in 2021. Research and development costs rose from $257m in 2020 to $420m in 2021. Expense have increased amid a steady expansion programme. The company’s headcount has increased and so have development costs, including those for advancing the hemoglobinopathies and immuno-oncology programmes.
Basic earnings per share came in at $4.97 for the year ending December 2021, up from a loss of $5.29 the year before.
At the end of 2021, CRISPR Therapeutics had a very healthy balance sheet with around $2.4 billion in cash, equivalents and short-term investments. Meanwhile, total debt only amounted to a manageable $225m. Total employees numbered 473, up from 410 at the end of 2020.
Pipeline
The firm’s burn rate doesn’t appear to be anything to worry about, and it looks like this biotech should be able to get a few products off the ground and onto the market before the money runs out. CRISPR has three 100%-owned gene-editing therapies in clinical trials and is co-developing two other therapies with partners Vertex Pharmaceuticals and ViaCyte.
In its latest update (Q1, 2022), CRISPR Therapeutics said it anticipated submitting global regulatory filings for CTX001 in late 2022. The company successfully reached full enrolment for stage Phase 3 clinical trials of the gene-edited therapy for TDT and SCD. CRISPR Therapeutics and Vertex have also initiated two new Phase 3 studies of CTX001 in children and infants with TDT and SCD.
The firm is also trailing Immuno-Oncology programmes and expects to report back with trial results later in 2022. CRISPR Therapeutics also said that enrolment was ongoing for the Phase 1 clinical trial for its type one diabetes candidate. The evasive-cell replacement therapy is designed to enable patients to produce their own insulin.
Valuation
While the company didn’t generate traditional sales in 2021, it generated plenty of revenue. In fact, it has a price-to-sales ratio of 5.8 for the trailing 12 months versus an industry average of 4.1. Meanwhile, CRISPR Therapeutics actually has a price-to-earnings ratio of 18.4 versus an industry average of 25.2. It is unclear whether the company will generate a similar level of revenue this year. Q2 of 2021 was the only quarter in the last 18 months in which it generated more than $15 million in revenue. As such, we can see that revenue is unlikely to grow consistently until it has a product on the market.
Despite the volatility of the past month, shares in CRISPR Therapeutics have actually gained considerably. The stock is up 32% over the past 30 days and now trades for $73 a share. The firm currently has market cap of around $5.4 billion. Despite the recent gains, CRISPR Therapeutics is still down 43% over the past 12 months.
Competition
CRISPR Therapeutics isn’t the only company exploring gene therapy. Beam Therapeutics also uses CRISPR technology. The company changes single bases in the genome using a technique called base editing. This method only breaks a single strand of the DNA and therefore may have higher cell survival rates. Beam is on track to start its clinical trial of BEACON-101 in treating SCD. The company focuses on hemoglobinopathy and oncology.
Another competitor is Apellis Pharmaceuticals. The biotech focuses on therapies that enhances the immune system's ability to clear damaged cells. Apellis’s main product is already approved in the US for treating paroxysmal nocturnal hemoglobinuria – a rare, acquired blood disease. It’s also conducting late-stage development for treating a cause of vision loss in old age.
Summary
Cathie Wood has backed a lot of big winners in the past. And I think CRISPR Therapeutics might be another big winner in the future. However, there are some considerable risks here.
Governments and regulators have been slow to back gene therapies. The US Food and Drug Administration (FDA) has approved only a small number of gene therapy products for sale in the United States to date. The UK has been cautious too, although it markets itself as the primary destination for advanced therapy treatments. CRISPR Therapeutics has noted caution on the part of regulators with regards to gene therapy treatments.
However, the future looks positive for the sector, and CRISPR Therapeutics appears to be at the forefront of the industry. It is speculative at this moment in time as none of the therapies have been approved for use. But it’s a stock that’d I’d be willing to back. At $73 a share, I think CRISPR Therapeutics looks like a good addition to my portfolio.


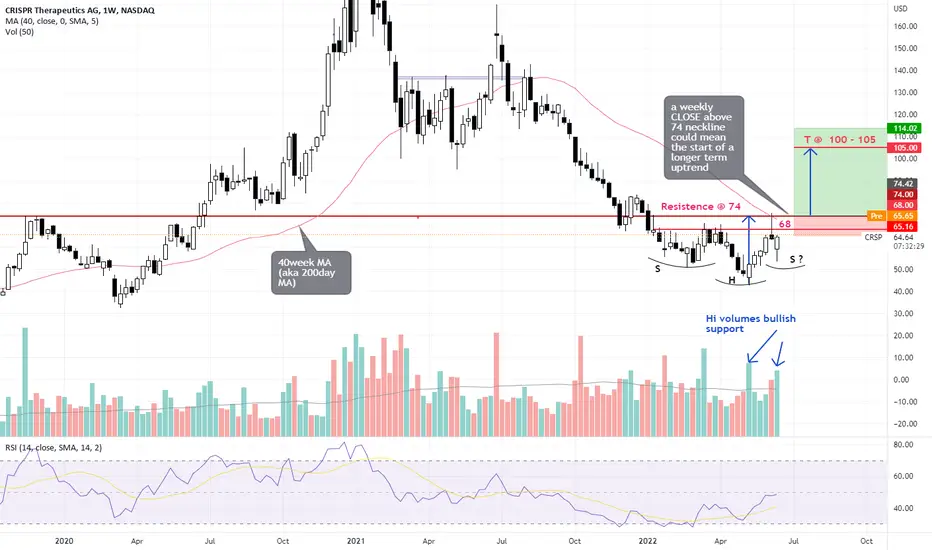
CRSP - bottoming in process?CRSP has been consolidating in what is potentially an inverted H&S pattern since hititng inot low on 12 May. Despite the overall market being extremely weak this week, CRSP dipped and quickly recovered forming a potentially bullish candle for this week.
If CRSP can have a weekly close above 68 then there could be grounds for more optimism. However, a weekly close above 74 (a longer term resistence and also the 200 days moving average) could up it's odds of sustaining a longer term uptrend.
We aren't at these levels yet so I'm just keeping a watch now.
p/s with overall US market being rather bearish right now, it is best to keep positions small and be ready to cut quickly if wrong.
Disclaimer: Just my 2 cents and not a trade advice. Kindly do your own due diligence and trade according to your own risk tolerance and don't forget that money management is important! Take care and Good Luck!
$CRSP ~ Expectation remains the same...As shown, expect submicro wave 2 pullback and then continue to push higher to fair market value. Overall beautiful elliottwave structures and upside expectation remains the same.

Crunch time for Crisp (r) ?CRISPR Therapeutics
Short Term - We look to Buy a break of 59.19 (stop at 54.06)
Further upside is expected and we look to set longs in early trade. A bullish reverse Head and Shoulders has formed. A break of yesterdays high would confirm bullish momentum. A higher correction is expected. Although the anticipated move higher is corrective, it does offer ample risk/reward today.
Our profit targets will be 70.94 and 79.82
Resistance: 60.00 / 70.95 / 80.00
Support: 58.00 / 50.00 / 42.00
Disclaimer – Saxo Bank Group. Please be reminded – you alone are responsible for your trading – both gains and losses. There is a very high degree of risk involved in trading. The technical analysis, like any and all indicators, strategies, columns, articles and other features accessible on/though this site (including those from Signal Centre) are for informational purposes only and should not be construed as investment advice by you. Such technical analysis are believed to be obtained from sources believed to be reliable, but not warrant their respective completeness or accuracy, or warrant any results from the use of the information. Your use of the technical analysis, as would also your use of any and all mentioned indicators, strategies, columns, articles and all other features, is entirely at your own risk and it is your sole responsibility to evaluate the accuracy, completeness and usefulness (including suitability) of the information. You should assess the risk of any trade with your financial adviser and make your own independent decision(s) regarding any tradable products which may be the subject matter of the technical analysis or any of the said indicators, strategies, columns, articles and all other features.
Please also be reminded that if despite the above, any of the said technical analysis (or any of the said indicators, strategies, columns, articles and other features accessible on/through this site) is found to be advisory or a recommendation; and not merely informational in nature, the same is in any event provided with the intention of being for general circulation and availability only. As such it is not intended to and does not form part of any offer or recommendation directed at you specifically, or have any regard to the investment objectives, financial situation or needs of yourself or any other specific person. Before committing to a trade or investment therefore, please seek advice from a financial or other professional adviser regarding the suitability of the product for you and (where available) read the relevant product offer/description documents, including the risk disclosures. If you do not wish to seek such financial advice, please still exercise your mind and consider carefully whether the product is suitable for you because you alone remain responsible for your trading – both gains and losses.

Long-term descending wedge breakout - BULLISHA clear breakout pattern on multiple timeframes on the classic descending wedge supported by bullish MACD.

$CRSP ~ Correction looks complete...Correction looks complete and now we are working on a five wave structure to the upside. Would expect upside to fair market value as shown.


#CRSP $CRSP easy follow the buy sell why not to double check for assured profit before you pay a dime
Easy line to follow and simple chart be your guide here , it works for a week in #trade

Long (potential takeover, solid pipeline, tons of cash)- potential aim for takover (I suppose by VRTX ) . Company has 2.5B in cash, no debt with market cap about 4.5B$ (EV = 2.0 B)
- solid pipeline and probably will be first who get FDA approval for commercial CRISPR product
- got most of up front payment for milestones in CRISPR among competitors ( about 1b$ from Vertex and collaboration with Bayer). BEAM for example got only 300m$ in up front payment, NTLA even less.
That means CRSP has enough cash for 4 years R&D without share offering and sustain global recession.

No brainer alpha at a cheap price1) Crisper has a lot of cash on hand to survive through tightening of QE and fund pipeline without dilution
2) Potential takeover by $VRTX or other compamy at current prices VERY possible.


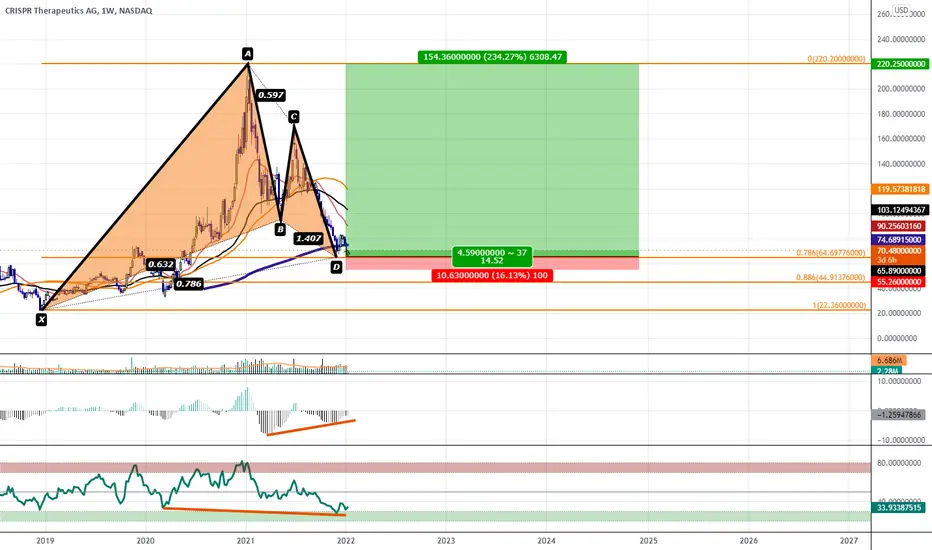
Bullish Gartley with Bullish Divergence Visible on the WeeklyWe have Classic Divergence on the MACD and Hidden Bullish Divergence on the RSI visible on the Weekly chart at the PCZ of a Bullish Gartley.
CRISPR- The future of medicine?I would buy 40% at this price
then if the price drops to $30-40 I'd buy the rest of the 60%

crispr call..aejfj;agiojagwejga ldak;jjewjg ag akgje;aijgwei vaie;jgijewpogjpwaeg wamaj;wefj pij;aewpfjoefj

$crsp - consolidation continues...I expect this to consolidate for the next few weeks.. probably into Q1/Q2 2022... leading to an eventual breakout to retest ATH

CRISPR Therapeutic needs to break 83.46. This is a critical testCrispr has been moving up since the Morning star break out on 13th December. Its further progress hinges on breaking the 83.46 resistance. It has tried piercing this resistance twice but failed. The resistance line at 83.46 and the upward support channel formed since 14th December at $70.37 is intersecting 83.46 on 28th December and CRSP has to break out before that to make any further progress. Option strategies can be deployed to exploit the opportunity either way.

nice downtrend break here! looking for a rally now 🍿fresh breakout past a 5 month downtrend on CRSP ! if it holds and doesn't break back into the trend potential price targets for early 2022 area 98.31-113.89-129.47
like and follow for more 💘
