NNDM — 6-Month Macro Chart Preface:
This chart should not be viewed in a vacuum.
I’ve linked my prior, more detailed NNDM macro thesis above — go read that first. This post is intentionally minimal and is meant to highlight the highest-timeframe structure.
What’s On This Chart
This chart has only two things:
A lo
Nano Dimension Ltd.
No trades
Next report date
—
Report period
—
EPS estimate
—
Revenue estimate
—
−1.24 USD
−96.35 M USD
58.05 M USD
211.65 M
About Nano Dimension Ltd.
Sector
Industry
CEO
David S. Stehlin
Website
Headquarters
Ness Ziona
Founded
2012
IPO date
Jan 1, 1977
Identifiers
3
ISIN US63008G2030
Nano Dimension Ltd. engages in the provision of intelligent machines for the fabrication of additively manufactured electronics. Its products include DragonFly IV, AME Materials, Fabrica 2.0, Fabrica Micro-AM Materials, Essemtec SMT Equipment, and Global Inkjet System. The company was founded by Amit Dror and Simon Anthony-Fried in 2012 and headquartered in Ness Ziona, Israel.
Related stocks

NNDM Macro Thesis (Monthly Structure)Preface:
I’m publishing my NNDM thesis as a series. This first part is strictly a high-level monthly view focused on macro structure: the post–Kathy Wood pump, the 2021 dump, and the years-long “accumulation” phase that followed.
This chart is intentionally clean. On this timeframe, structure and

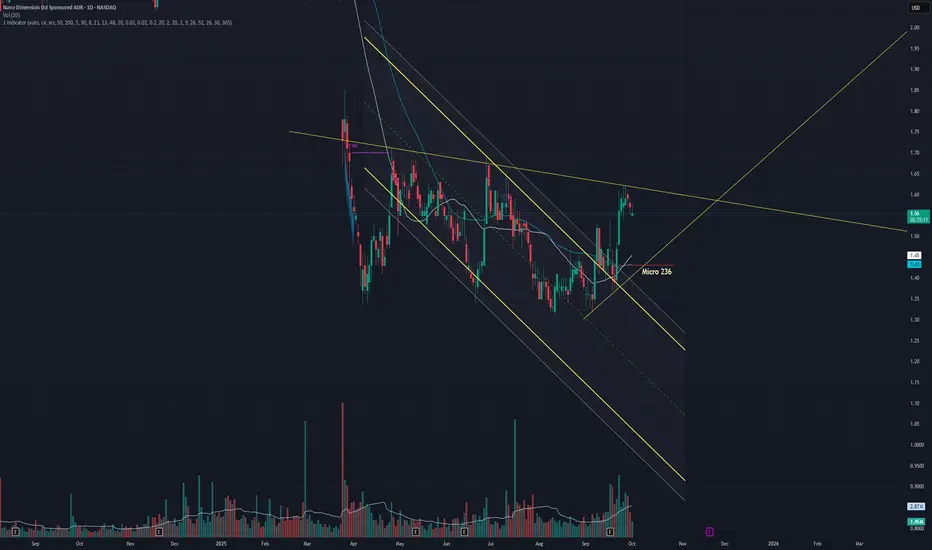
Updated NNDM Chart3 Day Chart:
NNDM after dropping out of a trading channel it held for years is looking to move back into this channel IMO.
We saw the price drop but find support right at the micro 236. This is pretty bullish We also see it's finding support on that trendline that has been around for a while. I
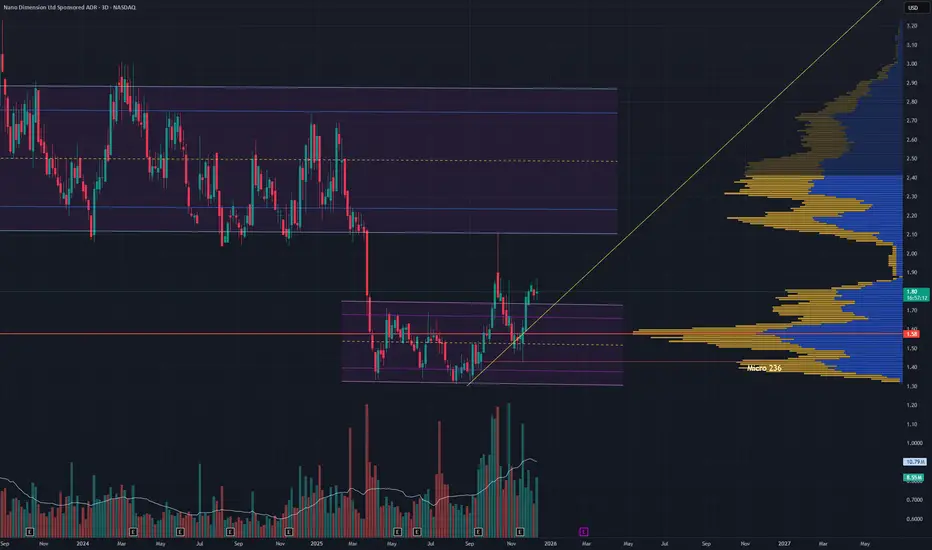
Will the $NNDM continue going upNNDM looks like it is on the second of three rising valley formations. As long as this retracement stays above the micro 236, I remain bullish.
Big GAP Down to buyBuy oportunity I think. MA 100 and 200 almost flat on W timeframe, BIG GAP down to be close.

NNDM -3D -Printing for Electronics Company- New Hyping Industry?Nano Dimension Ltd is a provider of intelligent machines for the fabrication of Additively Manufactured Electronics (AME). High-fidelity active electronic and electromechanical subassemblies are integral enablers of autonomous intelligent drones, cars, satellites, smartphones, and in medical devices

Is NNDM Consolidation Finally Over?Weekly chart is being shown but I will summarize key bullish points on the daily as well.
General Note:
Found support at the 236 retracement($2.19) of the last low to high. This means alot of paper hands have exited.
If this did not hold it would be bearish.
Price is above a downward Trend line.

My Last NNDM ChartDisclaimer: The fox is in the hen house. Murch has taken over and my investment strategy has now changed. I am no longer an investor and will be selling my position as the price skyrockets. Murch has done this before with Dryship. NNDM will be parceled out and sold off for cash.
Having said tha


Bearish BAT on NNDMScoped this Bearish Bat forming a while ago and wouldn't youknow it. NNDM makes another aquisition to push the stock up. Let's see if it completes.

See all ideas
Summarizing what the indicators are suggesting.
Oscillators
Neutral
SellBuy
Strong sellStrong buy
Strong sellSellNeutralBuyStrong buy
Oscillators
Neutral
SellBuy
Strong sellStrong buy
Strong sellSellNeutralBuyStrong buy
Summary
Neutral
SellBuy
Strong sellStrong buy
Strong sellSellNeutralBuyStrong buy
Summary
Neutral
SellBuy
Strong sellStrong buy
Strong sellSellNeutralBuyStrong buy
Summary
Neutral
SellBuy
Strong sellStrong buy
Strong sellSellNeutralBuyStrong buy
Moving Averages
Neutral
SellBuy
Strong sellStrong buy
Strong sellSellNeutralBuyStrong buy
Moving Averages
Neutral
SellBuy
Strong sellStrong buy
Strong sellSellNeutralBuyStrong buy
Displays a symbol's price movements over previous years to identify recurring trends.