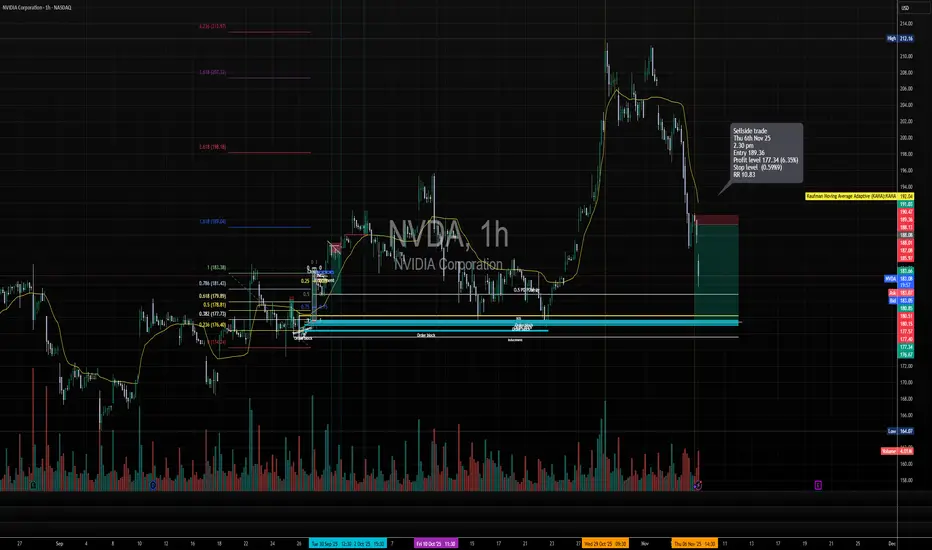
Short trade 📘 Trade Summary
Pair: NVDA (NASDAQ)
Direction: Sell-side Trade
Date: Thu 6 Nov 25
Time: 2:30 pm
Entry: 189.36
Profit Level: 177.34 (+6.35%)
Stop Level: 189.99 (–0.59%)
Risk-Reward (RR): 10.83
🧩 Technical Context
Price Structure: Market rejected near the previous swing high (~$197–$200 region) after failing to sustain above the 1.618 extension level.
Fibonacci Context: Retracement zones from 0.382 – 0.786 aligned with prior accumulation zones, showing resistance at 0.618 (≈ 179.89) and 0.786 (≈ 181.43).
Order Block Alignment: Two visible order blocks (highlighted in blue) show prior demand zones — price is expected to retrace into these for potential take-profit liquidity.
Volume Spike: Noticeable volume at the rejection candle near $190–$191 indicates institutional sell orders stepping in.
EMA Context: Price fell below the Kaufman Adaptive Moving Average (KAMA), confirming a short-term shift to bearish momentum.
🧠 Trade Narrative
This short setup capitalises on:
A failed breakout at the prior liquidity high (~$197),
Break of structure (BOS) confirming downside shift, and
Entry at the retest of a supply zone near $189.
Targeting liquidity sweep of prior accumulation zone around $177, where confluence with the lower order block exists.
Trade ideas
NVDA (NVIDIA) – Buy PlanNVDA (NVIDIA) – Buy Plan
📊 Market Sentiment
On October 29, the FED lowered rates by 25bps as expected. However, Powell’s remarks introduced uncertainty around further cuts in December, emphasizing that future policy will depend on incoming data.
One FED member dissented, preferring no cut this cycle — a notable shift from September’s unanimous decision.
Additionally, ADP Non-Farm Employment Change came at 42K versus 32K expected. It’s slightly higher, but since other macro data are missing due to the U.S. government shutdown, the overall sentiment remains mixed.
For now, macro sentiment leans bearish, as rate cuts may be delayed into 2026.
However, with NVDA earnings approaching, we could see a short-term bullish sentiment building around the stock.
📈 Technical Analysis
NVDA is currently trading around the 0.5 equilibrium zone, which aligns with the HTF bullish trendline.
This area could provide temporary support and a potential bounce setup.
However, it’s crucial to watch the SPY structure as it may influence NVDA’s short-term movement.
📌 Game Plan / Expectations
I’ll be watching the $185–$180 range as a key HTF support zone.
This area also aligns with a possible trendline deviation, where price could manipulate below the trendline to trap sellers before reclaiming it.
I plan to buy call options within this range, targeting a continuation of the bullish leg post-earnings.
💬 If this breakdown aligns with your outlook, like and comment below.
For deeper sentiment and strategy insights, subscribe to my Substack — free access available.
⚠️ Disclaimer
This analysis is for educational purposes only and does not constitute financial advice. Always conduct your own research before trading or investing.

Regional Growth Strategies in the Global Market1. Understanding Regional Growth Strategies
A regional growth strategy is a structured plan that focuses on expanding a company’s presence and market share within a specific geographic area—such as Asia-Pacific, Europe, Latin America, or Africa—rather than globally all at once. The strategy involves understanding local consumer behavior, economic conditions, legal frameworks, and cultural norms to align business goals with regional opportunities.
For example, a multinational company might apply different strategies in North America and Southeast Asia, depending on the maturity of markets, consumer preferences, and economic development levels. Regional strategies often integrate global goals with local execution—creating a balance between standardization and localization.
2. Importance of Regional Growth in the Global Market
Global markets are not uniform. Every region has unique growth potential and challenges. Companies that focus on regional strategies gain several advantages:
Market Diversification: Expanding regionally helps reduce dependence on a single country or market. For instance, if a business faces a slowdown in Europe, strong demand in Asia can balance overall performance.
Adaptation to Local Needs: Regional strategies allow businesses to adapt their offerings to local cultures, tastes, and regulations, increasing acceptance and customer loyalty.
Cost Efficiency and Supply Chain Optimization: Regional production hubs can reduce logistics costs and improve efficiency. For instance, companies may set up manufacturing in Southeast Asia to serve Asia-Pacific markets.
Regulatory Compliance: Understanding and aligning with local rules and trade policies help avoid legal risks and penalties.
Competitive Advantage: A company that understands local consumer behavior and cultural nuances gains an edge over global rivals that use one-size-fits-all approaches.
Thus, regional growth strategies are not just about expansion—they are about sustainable adaptation and long-term competitiveness.
3. Core Elements of a Regional Growth Strategy
A well-structured regional growth plan typically involves several interconnected components:
a. Market Research and Segmentation
Understanding the market is the first step. Businesses analyze demographic trends, purchasing power, consumer behavior, and local competitors. For example, companies entering India must understand price sensitivity and the growing demand for value-for-money products.
b. Localization of Products and Services
Localization goes beyond language translation. It involves adapting products to suit regional preferences. For instance, McDonald’s offers McSpicy Paneer burgers in India and Teriyaki burgers in Japan, catering to local tastes.
c. Strategic Partnerships and Alliances
Local partnerships—such as joint ventures or distribution alliances—help global firms navigate regulatory and cultural complexities. Partnerships also provide access to established networks and regional expertise.
d. Supply Chain and Infrastructure Development
Building regional supply chains ensures faster delivery and lower costs. For instance, automobile companies often establish regional assembly plants to meet local demand efficiently.
e. Branding and Marketing Adaptation
Marketing strategies should reflect regional culture, values, and communication styles. For example, Coca-Cola’s campaigns in Asia often emphasize community and celebration, aligning with cultural values.
f. Regulatory and Policy Alignment
Businesses must understand trade laws, tariffs, and regional trade agreements like ASEAN, EU, or NAFTA (now USMCA). Complying with local policies is key to smooth operations.
4. Types of Regional Growth Strategies
Different approaches are used depending on company goals, market maturity, and competition levels:
a. Market Penetration Strategy
Focusing on increasing market share within an existing regional market through pricing strategies, promotions, or better customer service.
b. Market Development Strategy
Introducing existing products into new regional markets. For instance, a European skincare brand entering Middle Eastern markets.
c. Product Development Strategy
Developing new or modified products to fit regional needs. For example, Samsung designs region-specific smartphone models based on network availability and local preferences.
d. Diversification Strategy
Entering new regions with entirely new products or services. This approach is riskier but can lead to higher rewards in emerging markets.
e. Regional Hub Strategy
Establishing a key operational hub (for example, Singapore for Southeast Asia or Dubai for the Middle East) to coordinate and manage operations across multiple countries.
5. Challenges in Implementing Regional Growth Strategies
While regional expansion offers great potential, it also presents significant challenges:
Cultural Barriers: Misunderstanding local customs and consumer behavior can lead to marketing failures or brand rejection.
Regulatory Complexity: Each country has its own laws, tax systems, and labor regulations that complicate operations.
Political Instability: In some regions, political changes or conflicts can disrupt business continuity.
Infrastructure Gaps: Emerging regions may lack efficient transportation or technology infrastructure, affecting supply chains.
Currency and Economic Risks: Fluctuations in exchange rates and inflation can affect profitability.
Talent Management: Recruiting and retaining skilled employees with regional expertise can be difficult.
Successful firms must anticipate and manage these risks through careful planning and local engagement.
6. Successful Examples of Regional Growth
Apple in China and India
Apple has strategically localized its regional operations in Asia. It opened retail stores in major Indian cities, offered region-specific financing options, and even began assembling iPhones locally to reduce import taxes. This regional approach improved affordability and expanded market reach.
Toyota in North America
Toyota localized production in the United States and Canada, adapting car designs to local preferences and regulatory standards. This reduced costs and built a strong regional brand image.
Netflix in Latin America and Asia
Netflix produces regional content like Korean dramas and Indian web series, reflecting cultural preferences and expanding its subscriber base. This localization has been key to its global dominance.
7. The Role of Digital Transformation in Regional Growth
Technology plays a vital role in modern regional strategies. Digital platforms enable companies to understand consumer data, predict trends, and market products regionally.
E-commerce platforms like Amazon or Alibaba use data analytics to tailor regional offers.
Social media marketing allows precise targeting of regional audiences.
Digital payment systems and mobile apps make products accessible in regions with developing banking systems.
The integration of technology allows companies to achieve scalable, efficient, and localized growth.
8. Future Outlook for Regional Strategies
As global markets become more interconnected yet regionally diverse, companies will increasingly adopt “glocalization”—thinking globally but acting locally. Regional trade blocs, sustainability goals, and digital ecosystems will shape the next phase of growth.
Businesses that blend global expertise with regional sensitivity will thrive in this evolving landscape. Emerging markets in Asia, Africa, and Latin America will continue to offer high-growth potential, while digital tools will make regional adaptation faster and smarter.
Conclusion
Regional growth strategies are at the heart of global business success. They enable companies to bridge the gap between global ambitions and local realities by understanding regional diversity and adapting operations accordingly. Through careful research, localization, partnerships, and technological integration, businesses can capture regional opportunities and build long-term competitiveness. While challenges exist—from cultural barriers to regulatory complexity—firms that master regional strategies not only expand their market reach but also create stronger, more resilient global brands.

Nvidia Just Under Major SupportNvidia seems to have been pulled down by the Dow just like Apple as both are just under major support. I'm sorry for my previous Nvidia chart that drew support near 140, I recognize where I screwed up, but this chart should be good. Fortunately actual 117 support wasn't that far below and my NVDA isn't too in the red.
NVDA has the lowest revenue multiple in years right now. I know it's well off it's long term trend line, but it's growth rate is unlike anything it's ever been so expecting a steeper trend line to appear makes a lot of sense. Eventually I would imagine we'll get back to that trend line, but not anytime soon.
The Dow hitting major support should finally lift NVDA and the others that have been dragged down like AAPL and AMZN.
Good luck!

$NVDA retracement Anticipating a retracement on NASDAQ:NVDA to 180 area with the lack of government funding and no crypto solution to the financial monetary system of the world. Nov 5th catalyst to larger drop for the broader market AMEX:SPY NASDAQ:QQQ and NASDAQ:NVDA

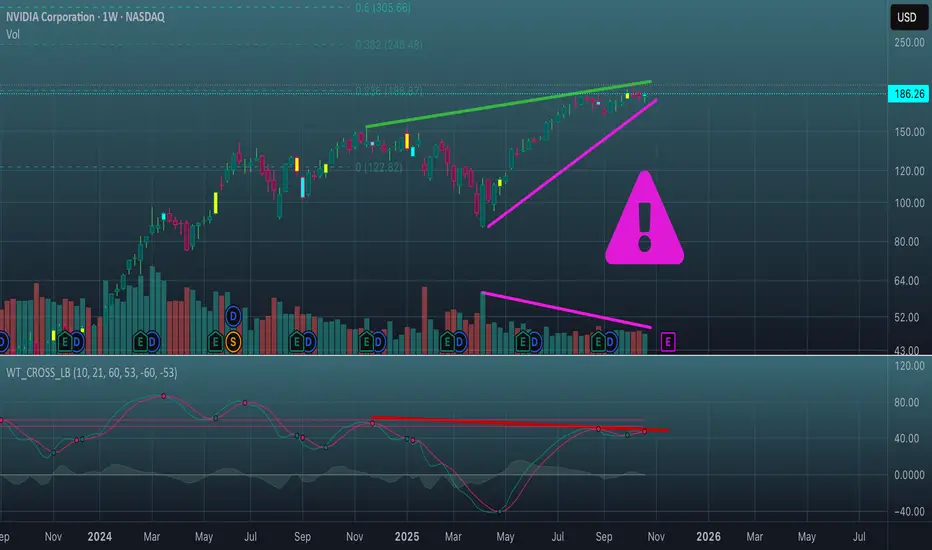
Elliott Waves Don’t Lie: NVDA’s Path to $26,000Summary: “Elliott Waves, Fibonacci, and Smart Money align perfectly — NVIDIA’s long-term chart points to an AI-powered Supercycle with massive upside." 💎📊
🚀 NVDA | The Supercycle of the AI Era! 💚
🌀 Elliott Wave Supercycle Breakdown
NVIDIA’s price action over the past two decades is a textbook example of a multi-decade Elliott Wave Supercycle — where technical , fundamentals , and Smart Money flows perfectly align to form a once-in-a-generation structure 🌎
Let’s break it down step-by-step 👇
Super Cycle Wave (1) — launched in the early 2000s, marking NVDA’s first growth phase during the birth of consumer GPUs 🎮.
Super Cycle Wave (2) — deep correction into 2002, retracing a 0.786 Fibonacci, cleansing early euphoria and creating the foundation for institutional accumulation 💼.
Then began the Super Cycle Wave (3) — the most powerful phase of all. Within it, we have distinct macro sub-waves:
1️⃣ Macro Wave (1) — ended in 2007 , aligning with the first institutional wave of adoption.
2️⃣ Macro Wave (2) — retraced 0.618 in 2008 , coinciding with the global financial crisis (perfect Smart Money shakeout).
3️⃣ Macro Wave (3) — the current dominant leg, fueled by exponential AI and data center growth . It’s extending toward the 3.618 Fibonacci extension (~$256) , confirming wave strength and institutional conviction.
4️⃣ Macro Wave (4) — expected between 2026–2027, likely retracing 0.236–0.382, a natural cooling period before the next breakout.
5️⃣ Macro Wave (5) — projected to rally toward 4.618 extension (~$2,500) , completing Super Cycle Wave (3) near 2029 🏁
From there, a larger Super Cycle Wave (4) correction could unfold before the final parabolic Super Cycle Wave (5) run to the 5.618 Fibonacci extension (~$26,000) — the climax of NVDA’s decades-long AI expansion super-trend 🌕
💰 Smart Money Concept (SMC) Perspective
The chart structure clearly shows Smart Money accumulation patterns in every correction phase:
Re-accumulation ranges appeared at every 0.618 retracement level 📊
Liquidity grabs below previous swing lows before strong impulsive moves ⚡
Fair Value Gaps (FVGs) filled during corrections, creating perfect liquidity imbalances that institutional players exploit
Currently, NVDA trades near a premium zone of Macro Wave (3), but Smart Money will likely reaccumulate during the upcoming Macro Wave (4) discount phase (2026–2027).
Expect Order Block re-tests and liquidity sweeps around discounted Fibonacci retracement zones (0.236–0.382) before the next major rally 📉➡️📈
📈 Price Action Structure
NVDA’s macro structure remains strongly bullish:
The multi-decade trend has respected every higher high and higher low sequence since 2008.
Each impulse is followed by a healthy re-accumulation range, never breaking long-term structure.
Expect distribution near the $250–$300 (split-adjusted) region as Wave (3) matures, followed by a macro correction that offers generational entries for long-term investors 🧠
🔢 Fibonacci Confluence & Technical Harmony
Fibonacci has been the invisible hand guiding NVDA’s growth 👇
0.786 retracement (2002) → deep liquidity reset
0.618 retracement (2008) → institutional re-entry
3.618 extension (256) → current macro resistance target
4.618 extension (2500) → Super Cycle Wave (3) final target
5.618 extension (26K) → ultimate Super Cycle Wave (5) projection
Each impulse and retracement aligns perfectly with Fibonacci’s geometric rhythm , proving the power of confluence between time, price, and sentiment.
🧠 Fundamentals — The Energy Behind the Waves
Behind the technicals lies unmatched fundamental growth :
💾 AI & Data Centers: NVIDIA is the core infrastructure for modern AI compute and cloud training workloads.
🧩 CUDA Ecosystem: A software moat that ties developers and enterprises directly to NVIDIA’s architecture.
🌐 Omniverse & Robotics: Positioning NVDA as a leader in 3D simulation, robotics, and digital twins — future trillion-dollar markets.
⚙️ Strategic Partnerships: Expanding across hyperscalers, automotives, and enterprise AI.
Each innovation wave fuels a new Elliott Wave impulse , with the AI revolution now driving the strongest macro leg in NVDA’s history.
⚡ Macro Outlook & Timeline
✅ Now (2025): Completing Macro Wave (3) of Super Cycle (3) → heading toward $256 target
⚠️ 2026–2027: Macro Wave (4) correction to 0.236–0.382 (Smart Money entry)
🚀 2028–2029: Macro Wave (5) push → Super Cycle (3) peak near $2,500
🌊 2030–2032: Super Cycle (4) correction — consolidation phase
💎 2035–2040+: Super Cycle (5) → ultimate 5.618 target near $26K
💬 Final Thoughts
"Every correction is a setup for the next expansion. Smart Money buys fear — not euphoria."
NVIDIA is the heartbeat of the AI revolution , the core of data-driven computing , and a living Fibonacci sequence in motion.
As long as fundamentals stay aligned with the wave rhythm, NVDA’s Supercycle will continue to redefine what’s possible in long-term growth. 🌌
#NVDA #ElliottWaveAnalysis #SmartMoneyConcept #PriceActionTrading #FibonacciMagic #AIRevolution #StockMarket #Investing #TradingViewCommunity #TechSupercycle #NVDAtoTheMoon #LongTermInvesting
💬 Traders, analysts, and wave watchers — your insights matter!
Have you spotted NVDA’s next move? Drop your Elliott Wave counts, confirmations, or constructive critiques below 👇 Let’s discuss NVIDIA’s structural evolution, AI-driven Supercycle, and long-term growth potential together 🚀💚
Every comment adds perspective — let’s decode this massive wave as a community! 🌊📈
— Team FIBCOS ⚡💎

NVIDIA BLOW OFF TOPNo question that this is a blow off top. Where does it end? Premarket open above the BB channel on Day and Week view.

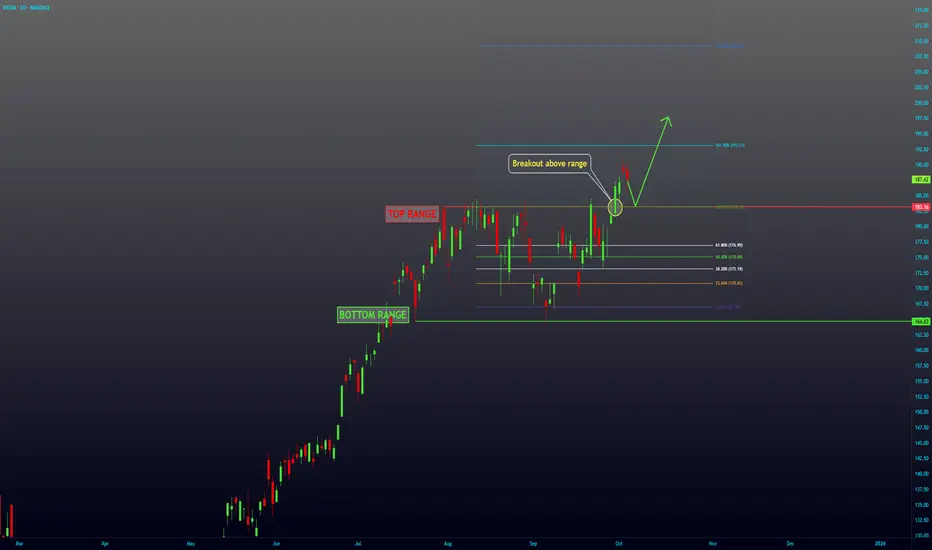
NVDA Breakout -- Continuation UPNASDAQ:NVDA has been in a range since end of July until September 30th, where it broke above the range. I expect to see more upside from here.
NVDA Wave Analysis – 29 October 2025- NVDA opened with the upward gap
- Likely to rise to resistance level 215.00
NVDA stock opened today with the sharp upward gap, which follows the earlier breakout of the resistance zone between the resistance levels 193.75 and 200.00.
The breakout of the these resistance levels accelerated the active impulse wave iii of the extended intermediate impulse sequence 5 from April
Given the overriding daily uptrend, NVDA can be expected to rise to the next resistance level 215.00 (target price for the completion of the active impulse wave iii).

NVIDIA At New HighsNvidia is making more upside this week, now trading above the 200 level on optimism that the US and China could reach a tariff deal. From an Elliott Wave perspective, the stock still appears to be in wave five, with an extended higher-degree black wave three now approaching its first resistance around the 38.2% projection. If risk-on sentiment continues, the price may even retest the upper side of the Elliott Wave channel near the 230 area. This suggests that Nvidia could be entering an important zone where the higher-degree black wave three might complete, followed later by a deeper fourth-wave retracement before more upside resumes. So, I would stay patient and watch for a possible dip toward the 164–185 area once wave four begins.
Highlights:
Trend: Ongoing uptrend; wave five still in progress
Potential: Reaching 230 resistance before wave four pullback
Support: 164–185 zone
Invalidation: Below 164
Note: Watch for signs of exhaustion near 230; next deep could offer new opportunity

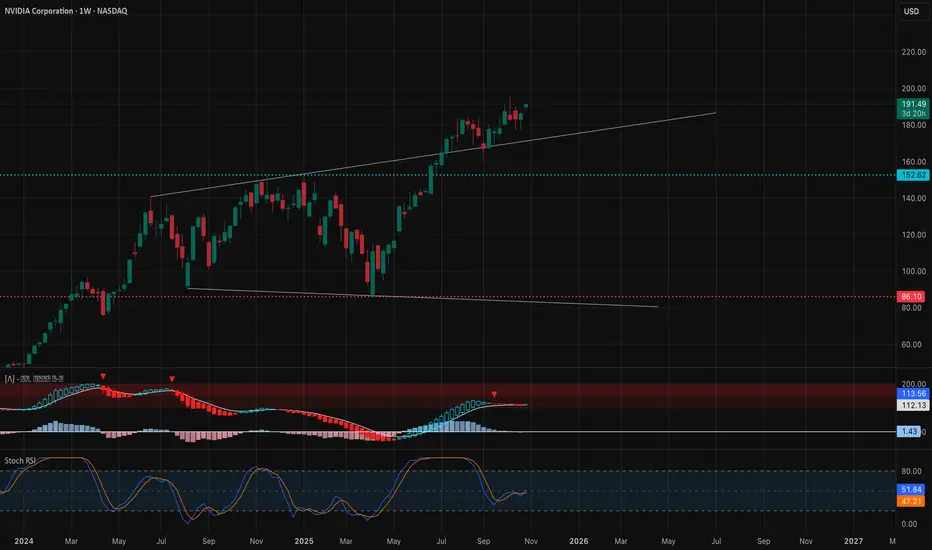
Will NVIDIA Retest Back at 1k Like in 2024 ?NVIDIA has been forming a clean long-term bullish structure:
After its 10-for-1 stock split in June 2024, the post-split equivalent of the previous all-time high (~$1,150+) becomes the ~$1,000 zone.
Price is currently establishing higher-lows around the $180-$200 range, which suggests support is stabilizing and a breakout could follow.
The resistance cluster appears in the ~$230-$300 range next. Once that zone is decisively cleared, momentum toward ~$1,000 becomes far more plausible.
Analysts have publicly discussed the possibility of NVIDIA reaching $1,000 or more, which adds a
structural framework for the move. InvestorPlace
Institutional demand for AI-infrastructure chips gives underlying support to the bullish case — the technical pattern is supported by real business strength.
Why a Retest of ~$1,000 Makes Sense to me?
The ~$1,000+ level represents the company’s prior pre-split peak, a major psychological barrier and structural target.
With the lower base (support zone) forming now and the demand side robust, the next leg higher is likely to unfold once resistance around ~$300 is cleared.
A move from ~$200 current to ~$1,000 is steep (~5×), but given the multi-year horizon and NVIDIA’s growth environment in AI, such a move aligns with long-term structural breakout patterns.
The consolidation phase now gives the market time to absorb recent gains, allowing for a cleaner push higher rather than a sharp parabolic rise (which often leads to rapid pull-backs).
Key Levels to Watch Support zone: ~$180-$200 — if this holds, the setup remains valid.
Critical resistance: ~$230-$300 — a confirmed breakout above this zone should trigger acceleration. Structural target: ~$1,000 — once the midpoint breakout structure is in motion, this level becomes a logical target.
Alternate scenario caution: If price drops below ~$180 and fails to regain ~$200 quickly, the setup would require reevaluation.
My Belief
I believe NVIDIA will retest the ~$1,000 level (or higher) over the next 1-2 years based on the clean structure, support formation, and macro-tailwinds in AI infrastructure. If the ~$230-$300 resistance is cleared convincingly, we’re entering the next leg of a multi-year bull run.
Links
NVIDIA 2024 1K

The Power Play Between Derivatives and HedgingIntroduction
In the complex and volatile world of financial markets, risk is an ever-present companion. Investors, corporations, and governments alike constantly seek ways to manage and mitigate these uncertainties. Two powerful instruments that dominate the modern financial landscape are derivatives and hedging. Both are closely interconnected—derivatives are the tools, while hedging is often the strategy. Together, they form a dynamic power play that influences global markets, stabilizes corporate earnings, and occasionally, when misused, leads to financial turmoil. Understanding the balance between these forces is essential for grasping how financial markets truly operate.
Understanding Derivatives: The Financial Instruments of Leverage
Derivatives are financial contracts whose value is derived from an underlying asset, index, rate, or event. These underlying assets can range from stocks, bonds, commodities, and interest rates to currencies and even weather conditions. The essence of a derivative lies in its dependency—its price moves in response to the value of something else.
Types of Derivatives
Futures Contracts
Futures are standardized agreements traded on exchanges to buy or sell an asset at a predetermined price and date in the future. They are widely used in commodities, indices, and currencies. For example, an airline company might use crude oil futures to lock in future fuel prices.
Options Contracts
Options give the holder the right, but not the obligation, to buy (call) or sell (put) an asset at a specific price within a specified period. Options are extremely popular among traders and institutions because they offer flexibility in hedging and speculation.
Swaps
Swaps involve exchanging one stream of cash flows for another. Common types include interest rate swaps and currency swaps. For instance, a company with variable-rate debt may enter into a swap to fix its interest payments and stabilize costs.
Forwards
Forwards are customized over-the-counter (OTC) agreements similar to futures but not traded on exchanges. They are tailored for specific needs, making them highly flexible yet riskier due to counterparty exposure.
Purpose of Derivatives
Derivatives serve multiple purposes:
Risk Management: They allow investors and corporations to hedge against adverse price movements.
Speculation: Traders use derivatives to profit from market volatility or price predictions.
Arbitrage: Derivatives help exploit price differences in markets to earn risk-free profits.
Leverage: A small amount of capital can control large positions, magnifying both gains and losses.
In essence, derivatives amplify financial capabilities, offering both protection and peril depending on how they are used.
The Art of Hedging: Controlling the Uncontrollable
Hedging is a strategy designed to reduce or eliminate the risk of adverse price movements in assets. It’s akin to buying insurance against potential financial loss. A hedge doesn’t necessarily eliminate risk—it transfers or mitigates it.
How Hedging Works
Suppose a wheat farmer is concerned that prices might fall by harvest time. By selling wheat futures now, the farmer locks in a price and ensures predictable income regardless of future market fluctuations. Similarly, an importer concerned about currency appreciation may use forward contracts to secure a fixed exchange rate.
Hedging typically involves taking an offsetting position in a related asset or derivative to counterbalance potential losses. If the market moves unfavorably in one position, the gain in the hedge offsets the loss, thereby stabilizing overall performance.
Common Hedging Techniques
Forward and Futures Hedging – Locking in prices today for future transactions.
Options Hedging – Purchasing options to protect against downside risk while retaining upside potential.
Swap Hedging – Managing exposure to interest rates or currency fluctuations.
Portfolio Diversification – Spreading investments across asset classes to reduce overall volatility.
Hedging, in short, is about stability and foresight—it prioritizes security over speculative gain.
Derivatives as the Engine of Hedging
The relationship between derivatives and hedging is symbiotic. Derivatives enable hedging strategies, providing the mechanism to offset risk exposure across markets. Without derivatives, hedging would be limited to traditional methods like asset diversification or insurance, which are often slower, less efficient, and more costly.
For instance:
Commodity producers use futures and options to stabilize revenues.
Exporters and importers hedge against foreign exchange risks through currency forwards and swaps.
Investors protect portfolios from market downturns using index options or equity futures.
Banks manage interest rate risk using interest rate swaps and caps.
This interplay creates a more stable financial ecosystem—when used prudently. Derivatives make markets more liquid and efficient, allowing participants to distribute risk where it can best be managed.
The Power and Peril: When Derivatives Overwhelm Hedging
While derivatives are powerful risk management tools, their misuse can amplify market instability. The same leverage that makes them effective hedging instruments can also turn them into speculative weapons.
Historical Examples of Misuse
Barings Bank Collapse (1995)
A single trader, Nick Leeson, made unauthorized derivatives trades in the Singapore futures market, resulting in losses exceeding £800 million. His speculation, disguised as hedging, bankrupted one of Britain’s oldest banks.
Long-Term Capital Management (LTCM) Crisis (1998)
LTCM used highly leveraged derivative positions to exploit small market inefficiencies. When markets turned volatile, the fund’s positions spiraled out of control, threatening the global financial system.
Global Financial Crisis (2008)
The widespread use of credit default swaps (CDS) on mortgage-backed securities created massive systemic risk. What began as a hedging tool evolved into a speculative bubble, culminating in a global meltdown.
These cases highlight that derivatives without proper risk control can undermine financial stability. The thin line between hedging and speculation defines whether derivatives act as a shield or a sword.
Corporate Hedging Strategies: Real-World Applications
Corporations across sectors rely heavily on derivative-based hedging to protect against market uncertainties.
1. Currency Risk Management
Multinational corporations face constant foreign exchange volatility. For instance, Infosys and Tata Consultancy Services (TCS) use currency forwards and options to manage rupee-dollar exchange rate exposure. These hedges protect profit margins despite currency fluctuations.
2. Commodity Price Protection
Oil producers, airlines, and food companies frequently hedge input costs. Southwest Airlines, for example, famously used long-term crude oil futures to secure low fuel prices during the 2000s, giving it a massive competitive advantage.
3. Interest Rate Risk Control
Financial institutions use interest rate swaps to stabilize returns. A bank holding floating-rate loans may enter into a swap to receive fixed payments, shielding itself from rising rates.
4. Portfolio Risk Hedging
Institutional investors employ derivatives like put options on stock indices to guard against market downturns. These hedges act as “insurance policies” for portfolios, especially during economic uncertainty.
In these scenarios, derivatives serve as precision tools that allow corporations to forecast and control financial outcomes.
Regulatory Oversight and Risk Management
Given the complexity and potential risks, global regulators have tightened oversight of derivatives markets. The Dodd-Frank Act (2010) in the United States and similar regulations in Europe and Asia mandate greater transparency and reporting for derivative trades.
Key Regulatory Measures:
Central Clearing: Standardized derivatives must pass through clearinghouses to reduce counterparty risk.
Reporting Requirements: All trades must be recorded in trade repositories to improve market transparency.
Margin Requirements: Participants must post collateral to prevent excessive leverage.
Risk Management Standards: Firms must establish internal controls and limits on derivative exposures.
These measures aim to restore balance—allowing derivatives to support hedging rather than fuel speculation.
Technological Influence: Algorithmic and AI-Driven Hedging
In the digital era, technology has revolutionized derivative trading and hedging strategies. Algorithmic models and artificial intelligence (AI) now play key roles in managing risk dynamically.
AI-Based Risk Prediction: Machine learning models analyze real-time market data to anticipate price movements and adjust hedges instantly.
Automated Hedging Systems: Advanced algorithms execute complex hedging strategies across multiple asset classes simultaneously.
Blockchain and Smart Contracts: These technologies enhance transparency and efficiency in derivative settlements.
Such innovations have made hedging more precise, faster, and cost-effective—but also more dependent on data integrity and cybersecurity.
The Strategic Balance: Hedging vs. Speculation
The power play between derivatives and hedging ultimately lies in their dual nature. The same instrument can serve either purpose—risk mitigation or risk creation—depending on how it’s used.
Hedging Focus: The objective is protection. Gains are secondary; stability is paramount.
Speculative Focus: The objective is profit. Risk-taking is intentional, often amplified by leverage.
A mature financial system depends on equilibrium between these forces. Without hedgers, markets would lack stability. Without speculators, liquidity would vanish. Together, they form a dynamic yet delicate ecosystem that drives modern finance.
Future Outlook: Evolving Role of Derivatives and Hedging
As global markets grow more interconnected and digitalized, the role of derivatives and hedging will continue to expand.
Green Derivatives: Instruments linked to carbon credits and ESG benchmarks are emerging, helping companies hedge sustainability risks.
Crypto Derivatives: With digital assets gaining traction, crypto futures and options are reshaping speculative and hedging opportunities.
AI-Driven Risk Management: Predictive analytics will make hedging more adaptive to real-time market conditions.
Decentralized Finance (DeFi): Blockchain-based derivative platforms are redefining transparency and access.
The future promises both efficiency and complexity—requiring even stronger governance and risk literacy.
Conclusion
The power play between derivatives and hedging defines the heartbeat of modern finance. Derivatives, with their vast potential, empower investors and corporations to manage risk, enhance returns, and navigate uncertainty. Hedging, on the other hand, channels this power responsibly, ensuring stability amid volatility. Yet, when derivatives shift from tools of protection to instruments of speculation, the balance of power tilts dangerously.
Ultimately, the key lies not in choosing between derivatives and hedging, but in mastering their synergy. When wielded wisely, they create a resilient, efficient, and innovative financial system capable of weathering the storms of global uncertainty.
NVDA Climbs to Record Levels as Elliott Wave (5) UnfoldsNvidia (NVDA) continues its impulsive cycle from the April 2025 low, manifesting a clear five-wave advance. The stock now progresses through the terminal wave ((5)), which subdivides into a nested five-wave structure of lesser degree. The advance originated at the wave ((4)) low of $164.07, where wave (1) rallied to $195.62. A subsequent correction in wave (2) concluded at $176.18, as evidenced by the 30-minute chart. From this point, wave (3) resumed the upward trajectory.
Within wave (3), wave 1 terminated at $185.20, followed by a retracement in wave 2 to $176.76. The rally then accelerated in wave 3. From the wave 2 low, wave ((i)) completed at $195.47, and wave ((ii)) found support at $191.91. The structure projects further extension in wave ((iii)), followed by a consolidation in wave ((iv)) before the final push in wave ((v)) of 3. This internal progression supports a series of higher highs, continuing until wave (5) of ((5)) reaches completion and concludes the cycle from April 2025.
Near-term support remains firmly established at the $176.18 pivot low. As long as this level holds, any corrective dips—typically unfolding in three, seven, or eleven swings—should attract buyers and set the stage for additional upside. The overall impulsive framework remains intact, with bullish momentum driving the advance in accordance with Elliott Wave principles.

NVDA Bullish Breakout: Retest or Close Above 212.19 Toward 225NVDA’s daily chart remains firmly bullish after a clean breakout from a multi-month rectangle. Price is riding a MA20 > MA60 > MA120 stack, Bollinger Bands are expanding, and MACD momentum has flipped higher. The last close near $207.04 came on strong breadth, keeping buyers in control while price consolidates just under the recent high.
Primary path: look for a controlled pullback into the former ceiling at $198.00–$202.00 to act as demand. A constructive reaction there keeps the breakout intact and favors a grind into $210–$215 first, with the measured move pointing toward $225 as momentum persists. Alternatively, strength can skip the retest— a decisive daily close above $212.19 would confirm continuation and unlock the same upside roadmap.
Invalidation sits below the range top: a daily close back under $195.00 would negate the breakout and re-open downside toward the prior consolidation zone, with risk of a slide toward the $188 area if sellers press. Until then, the bias stays bullish with $198.00–$202.00 as the key line in the sand and $212.19 the trigger for fresh highs.
This is a study, not financial advice. Manage risk and invalidations

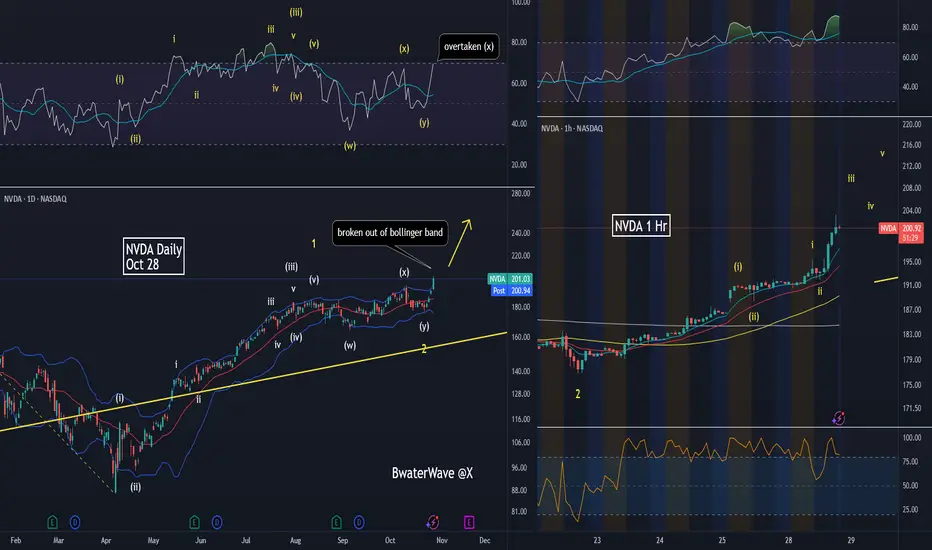
NVDA wave 3 in progressNASDAQ:NVDA just started the most powerful wave 3 of (3):
1. RSI confirms it.
2. Today's daily candle falls outside the Bollinger band and closes on top range.
3. Intraday 1 Hour shows we are still very early in this wave 3.
Please give my idea a boost and feel free to follow me if you like my ideas.
Nvidia (NVDA) Shares Surpass $200 for the First TimeNvidia (NVDA) Shares Surpass $200 for the First Time
Yesterday, Nvidia’s (NVDA) share price climbed above the psychological threshold of $200 for the first time, pushing the company’s market capitalisation close to $5 trillion.
Why Are NVDA Shares Rising Today?
Several bullish factors are driving Nvidia’s share price higher:
→ Massive order backlog: The company reported pre-orders for its AI processors totalling an astonishing $500 billion.
→ Strategic partnership with the US government: CEO Jensen Huang announced plans to build seven AI supercomputers for the US Department of Energy.
→ Expansion into telecoms: Nvidia has invested $1 billion in Nokia, acquiring a 2.9% stake in the Finnish company to jointly develop AI-RAN and 6G technologies.
Technical Analysis of Nvidia (NVDA)
Back on 23 September, our analysis of the NVDA chart identified:
→ an upward channel outlining the stock’s price movements this autumn;
→ a breakout from a Bullish Flag pattern (shown in red);
→ a projection that strong fundamentals, the rapid advance of AI technology, and expectations of a Fed rate cut could enable bulls to overcome the $183 resistance level and target the psychological $200 mark.
That projection has materialised since:
→ the Bullish Flag breakout level has acted as support (marked with a bold blue line);
→ NVDA price swings have provided anchor points to refine the current channel.
What’s Next for Nvidia Shares?
Note the bullish gaps (highlighted by arrows) that indicate a demand imbalance. The rapidly strengthening upward momentum could drive NVDA’s share price towards the upper boundary of the channel, particularly as several major events approach today:
→ the Federal Reserve’s interest rate decision and subsequent press conference;
→ quarterly earnings releases from Microsoft (MSFT), Alphabet (GOOGL), and Meta Platforms (META), all of which are expected to reaffirm their commitment to AI development.
This article represents the opinion of the Companies operating under the FXOpen brand only. It is not to be construed as an offer, solicitation, or recommendation with respect to products and services provided by the Companies operating under the FXOpen brand, nor is it to be considered financial advice.

NVDA Weekly Outlook (Oct 28–31)NVDA Weekly Outlook (Oct 28–31): “AI Giant Reawakens — Eyes on $200 Breakout!” ⚙️
1. Weekly (1W) Structure – Macro Strength
NVIDIA is maintaining a strong bullish structure on the weekly chart, with multiple Breaks of Structure (BOS) confirming sustained institutional demand. After a temporary Change of Character (CHoCH) in September, price reclaimed momentum above $185 and is now pressing toward the $197–$200 resistance zone.
* Bias: Bullish continuation with trend support at $160–$165
* Support: $152 → $160
* Resistance: $197 → $205
* MACD: Steadily positive, histogram expanding — momentum accelerating.
* Stochastic: Trending upward from mid-range — room to push higher.
💡 Weekly Thought:
The structure suggests NVDA is forming a strong continuation leg, potentially aiming for a retest of $200–$205 if the AI and semiconductor sector continues its leadership rally.
2. Daily (1D) – Mid-Term Momentum
On the daily chart, NVDA broke out from a corrective CHoCH near $164 and reclaimed the ascending trendline. This move confirms bullish re-entry after testing demand around $170–$175. Price is now nearing the upper boundary of the short-term channel, with potential for a breakout continuation toward $197–$200.
* Bias: Bullish, with trend acceleration visible.
* Support: $184 → $176 (key demand zone)
* Resistance: $197 → $200
* Indicators:
* MACD turning back up after reset — confirming bullish continuation.
* Stochastic RSI crossing up from oversold — aligning with buyer momentum.
💭 Daily Suggestion:
Wait for a light pullback to $187–$188 for call entries. If NVDA sustains above $191, expect a grind higher to $197–$200 before month-end.
3. 1-Hour (1H) – Intraday Structure
Intraday structure remains firm. NVDA has printed consecutive BOS patterns with minimal retracements — a hallmark of institutional stepping. The latest CHoCH near $186 acted as a liquidity sweep before pushing higher.
* Scalp Bias: Bullish above $188
* Resistance: $192 → $195 → $197
* Support: $186 → $183
* Setup Idea:
* Call scalp: Above $191 with momentum confirmation; target $195–$197.
* Put scalp: Only valid below $185, targeting $182.
📈 1H Thought:
Short-term traders can trail profits on breakouts above $191. Any dip toward $186–$187 may offer strong long opportunities if momentum remains intact.
4. GEX & Options Sentiment – Institutional Positioning
Gamma Exposure (GEX) shows clear bullish call accumulation with the strongest walls around the $190–$200 range.
* Highest positive GEX / resistance: $191.5 → $197 → $200
* Support (put-dominated zones): $187 → $182 → $176
* Call flow: +27.3% net GEX (call-biased)
* IVR: 25 (low-to-neutral)
* IVx avg: 53.8 (slightly elevated volatility window)
Institutional positioning implies a controlled bullish grind — with gamma pinning around $190–$195 that could later expand to $200 if momentum persists.
5. Suggested Option Plays
* Bullish Setup (Preferred):
* Buy-to-open 190C–195C (1DTE/2DTE) on breakout above $191.
* Target: $197–$200
* Stop: Below $186
* Reason: Call concentration above 190 supports continuation move.
* Bearish Hedge:
* Buy 180P (1DTE/2DTE) only if NVDA breaks $185 with volume.
* Target: $177
* Stop: Above $190
NVIDIA’s structure is aligned bullishly across all timeframes — higher lows, consistent BOS patterns, and call-heavy gamma flow all suggest momentum continuation toward $197–$200 before potential consolidation.
Short-term traders can look to scalp the $191–$195 zone with calls, while swing traders can hold positions into the breakout channel’s upper range.
🎯 Primary Bias: Bullish toward $200
⚠️ Watch For: Failing to hold $185 = short-term weakness or sideways phase.
This analysis is for educational purposes only and does not constitute financial advice. Always do your own research and manage your risk before trading.
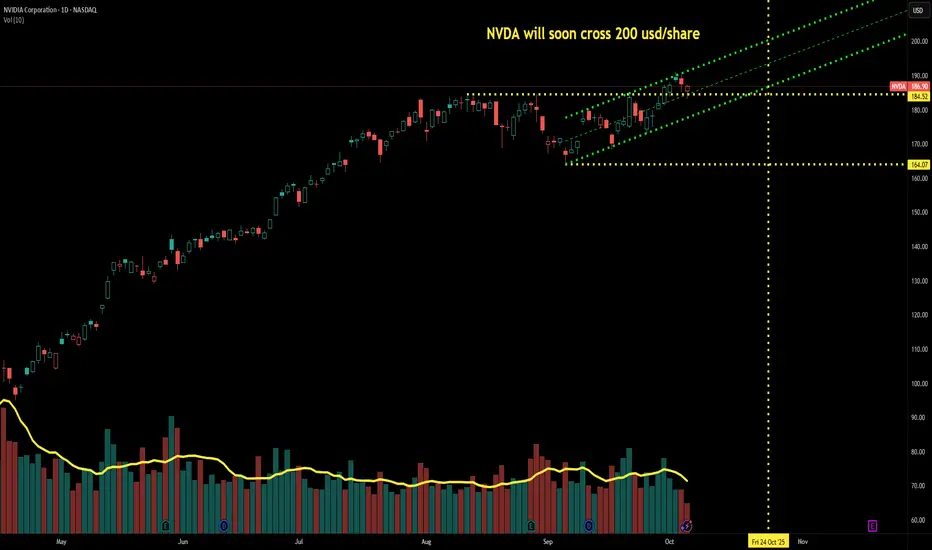
NVDA will pass 200 in the next 3 weeksFinishing the correction,
breaking above resistance,
pullback,
Marching toward the new All Time High
NVIDIA on an amazing run! NVIDIA on an amazing run!, still some room to go.
The daily, weekly & monthly look good, and November could be explosive.
NVIDIA have been doing big deals every week, so no stopping it.
$220 could come soon, then let's see what happens into earnings. sell off? or more good news?

Nvidia Downside. No clue. Upside levels to hit Break out here Above $191.83 ^ 193.03 ^195.67 Downside. I don't have a clue. You wonder, can it stay bullish forever? Seasonality might play a role also. The fair value GAP Thanks to ICT. That the price Range that occupies right now. that is in. Needs to. break above that. And the fib top. For play, but that's for sure sign. I guarantee IT To run out the highs. No reason for me to think otherwise. NASDAQ, S&P Keep walking up the steps. Mark IT DOWN smoky. This is risky, I know, but ICT might even play it to the downside. At this point, if it cannot break out191.64 This technique was all designed for playing futures NQ & ES And forex But he taught me it can be used on everything Algorithmics 101manipulation 101 also.#NVDA2THEMOON

Recovery is needed.Damn, the picture looks like a carbon copy TSLA.
There may be a few more sideways candles,
but the overall picture points to a correction.
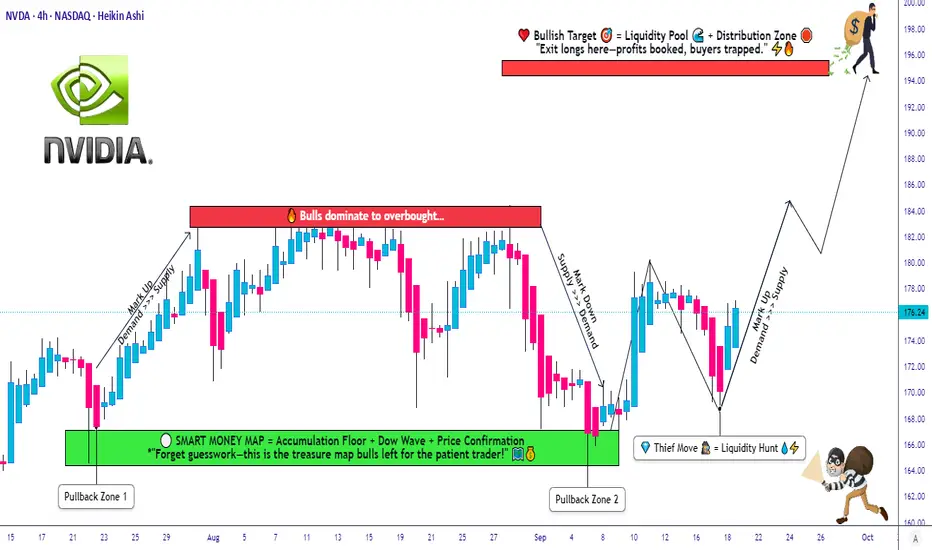
NVDA Setup Explained: Layered Entry + Clear SL/TP Levels😎 NVDA Thief’s Wealth Heist: Swing/Day Trade Blueprint 🚀
Asset: NVIDIA Corporation (NVDA) 📈Vibe: Bullish, sneaky, and ready to snatch profits with style! 💰
Welcome, ladies and gentlemen, to the Thief’s OG Wealth Strategy Map for NVDA!
This is a fun swing/day trading plan designed to grab liquidity like a master thief. Let’s break down this bullish setup with a double bottom pullback, layered entries, and a cheeky escape plan. Ready to outsmart the market? 🕵️♂️
📊 Market Analysis: Why NVDA?
NVDA is riding a bullish wave 🌊, confirmed by a double bottom pullback pattern and a sneaky liquidity grab at key support levels. The stock’s momentum is screaming “UP!” as buyers step in to defend the price. This setup is perfect for swing or day traders looking to capitalize on NVIDIA’s tech-fueled surge. 💻
🗺️ The Thief’s Plan: Bullish Heist Strategy
🎯 Entry Strategy:Deploy the Thief’s Layering Tactic with multiple buy limit orders to maximize your entry precision.
Suggested price levels:
$172.00
$174.00
$176.00
$178.00
Pro Tip: Feel free to add more layers based on your risk appetite and market conditions. The more, the merrier! 🧑💼
🛑 Stop Loss (SL):Set a Thief’s SL at $168.00 to protect your loot.
Note: Dear Thief OGs, this SL is my suggestion, but you’re the boss of your trades! Adjust based on your risk tolerance and let the profits roll. 💸
🎉 Take Profit (TP):Aim for the juicy $195.00 target, where we expect strong resistance, potential overbought conditions, and a possible trap for the unprepared. Lock in those hard-earned gains and escape like a pro! 🏃♂️
Note: This TP is my call, but you do you! Take profits at your own pace and keep the cash flowin’. 😎
🔗 Related Pairs to Watch (in USD)
To boost your market awareness, keep an eye on these correlated assets:
NASDAQ:AMD (Advanced Micro Devices): NVDA’s chipmaking cousin often moves in tandem. A bullish NVDA could signal strength in AMD. 📡
NASDAQ:SMH (VanEck Semiconductor ETF): This ETF tracks the semiconductor sector, including NVDA. Watch for sector-wide momentum. 📊
NASDAQ:QQQ (Invesco QQQ Trust): NVDA’s a heavy hitter in this tech-heavy ETF. QQQ’s trend can confirm NVDA’s direction. 🚀
Key Correlation Point: NVDA’s performance is tied to the broader semiconductor and tech sector. If AMD or SMH shows bullish patterns, it reinforces NVDA’s upside potential. Conversely, weakness in QQQ could signal caution. Stay sharp, thieves! 🕵️
🛠️ Why This Setup Rocks
Double Bottom Pullback: A textbook bullish reversal pattern, signaling strong buying interest. 📉➡️📈
Liquidity Grab: The market’s attempt to shake out weak hands before the real move up. We’re smarter than that! 😏
Layered Entries: Spread your risk across multiple price levels for a smoother ride. 🎢
Risk Management: Clear SL and TP levels keep your heist disciplined and profitable. 🧠
⚠️ Disclaimer
This Thief Style Trading Strategy is just for fun and educational purposes! I’m not a financial advisor, and trading involves risks. Make your own decisions, manage your risk, and trade responsibly. Let’s keep the vibes high and the losses low! 😜
✨ “If you find value in my analysis, a 👍 and 🚀 boost is much appreciated — it helps me share more setups with the community!”
#NVIDIA #NVDA #Trading #SwingTrading #DayTrading #ThiefStrategy #StockMarket #Bullish #TechnicalAnalysis
Definition and Relationship between Interest Rates and InflationIntroduction
Interest rates and inflation are two of the most important macroeconomic variables that influence the health, stability, and direction of any economy. They play a vital role in shaping economic growth, consumption patterns, investment decisions, and monetary policy. Economists, central banks, and policymakers constantly monitor the movement of interest rates and inflation because they are closely interconnected. A change in one often triggers a response in the other. Understanding their definitions, types, and interrelationship provides insight into how monetary policy stabilizes the economy and controls price levels.
Definition of Interest Rates
An interest rate is the cost of borrowing money or the return earned on savings or investments, expressed as a percentage of the principal amount per unit of time (usually per year). Essentially, it represents the price of money. When individuals, businesses, or governments borrow funds, they pay interest as compensation to the lender for parting with liquidity and bearing risk.
From an economic standpoint, interest rates are a tool to balance the demand for and supply of money. Central banks, such as the Reserve Bank of India (RBI) or the Federal Reserve in the U.S., use interest rates as a primary monetary policy instrument to influence economic activity.
Types of Interest Rates
Nominal Interest Rate: The stated rate without adjusting for inflation. It represents the actual amount paid or received in monetary terms.
Real Interest Rate: The nominal rate adjusted for inflation. It reflects the true cost of borrowing and the real return to lenders. The relationship is given by:
Real Interest Rate
=
Nominal Interest Rate
−
Inflation Rate
Real Interest Rate=Nominal Interest Rate−Inflation Rate
Policy Rate: The rate set by the central bank to regulate credit in the economy. Examples include the repo rate and reverse repo rate in India.
Market Interest Rate: Determined by the forces of demand and supply of money in financial markets.
Definition of Inflation
Inflation refers to the sustained increase in the general price level of goods and services in an economy over a period of time. When prices rise, the purchasing power of money decreases, meaning that each unit of currency buys fewer goods and services.
Inflation is not inherently bad—moderate inflation encourages spending and investment. However, excessive inflation erodes the value of savings, disrupts economic planning, and may lead to social and economic instability. Conversely, deflation, or the decline in prices, can be equally harmful because it discourages spending and investment, leading to lower economic growth.
Types of Inflation
Demand-Pull Inflation: Occurs when aggregate demand exceeds aggregate supply, causing upward pressure on prices.
Cost-Push Inflation: Arises when production costs (like wages and raw materials) increase, leading to higher prices for goods and services.
Built-In Inflation: Stems from the wage-price spiral, where workers demand higher wages to keep up with rising prices, which in turn increases production costs.
Hyperinflation: Extremely rapid and uncontrolled inflation, usually above 50% per month.
Stagflation: A condition where inflation and unemployment rise simultaneously, posing a severe challenge for policymakers.
The Relationship between Interest Rates and Inflation
Interest rates and inflation share a strong, inverse, and dynamic relationship. Generally, when inflation rises, central banks increase interest rates to control it. Conversely, when inflation falls or economic growth slows, they reduce interest rates to encourage borrowing and spending.
The interaction between the two can be understood through the following mechanisms:
1. The Fisher Effect
The Fisher Effect, named after economist Irving Fisher, explains the relationship between nominal interest rates, real interest rates, and expected inflation. According to this theory, the nominal interest rate is equal to the sum of the real interest rate and the expected inflation rate.
𝑖
=
𝑟
+
𝜋
𝑒
i=r+π
e
Where,
𝑖
i = Nominal interest rate
𝑟
r = Real interest rate
𝜋
𝑒
π
e
= Expected inflation rate
If inflation expectations rise, lenders demand higher nominal rates to maintain the same real return. This mechanism ensures that real returns remain stable despite fluctuations in price levels.
2. Central Bank Policy Response
Central banks play a key role in managing the relationship between interest rates and inflation. When inflation rises beyond the target (for example, above the RBI’s comfort zone of 4 ± 2%), the central bank raises policy rates such as the repo rate. This increases the cost of borrowing, reduces money supply, and cools down demand, thereby reducing inflationary pressure.
On the other hand, during periods of low inflation or deflation, the central bank cuts interest rates to stimulate borrowing, investment, and spending, which helps increase demand and stabilize prices.
3. Transmission Mechanism
Changes in policy rates affect inflation through the monetary policy transmission mechanism:
Higher interest rates → Higher borrowing costs → Reduced consumer spending and business investment → Lower aggregate demand → Reduced inflation.
Lower interest rates → Cheaper credit → Increased spending and investment → Higher aggregate demand → Rising inflation.
This process, however, takes time, and the impact may vary depending on the economy’s structure and financial system efficiency.
4. Inflation Expectations and Real Interest Rate
Inflation expectations influence both consumer behavior and monetary policy. If people expect future inflation to be high, they tend to spend more now, further driving up prices. Central banks, therefore, aim to anchor inflation expectations by maintaining credibility in their policies. Real interest rates (nominal minus inflation) provide the true measure of whether monetary policy is expansionary or contractionary.
For instance, if the nominal rate is 6% and inflation is 5%, the real interest rate is only 1%, indicating easy monetary conditions. Conversely, if inflation is 2% and the nominal rate is 6%, the real rate is 4%, signaling a tighter policy stance.
Impact of Inflation on Interest Rates
Rising Inflation → Higher Interest Rates:
When inflation increases, lenders demand higher nominal interest rates to offset the loss in purchasing power. Central banks raise policy rates to control excess demand and price rises.
Falling Inflation → Lower Interest Rates:
Low inflation reduces the pressure on monetary authorities, allowing them to lower interest rates and stimulate growth.
Unexpected Inflation → Distorted Interest Rates:
If inflation rises unexpectedly, borrowers benefit because they repay loans with money that has less value, while lenders lose purchasing power.
Impact of Interest Rates on Inflation
Tight Monetary Policy:
Raising interest rates reduces credit availability, slows economic activity, and curbs inflationary trends.
Loose Monetary Policy:
Lowering interest rates encourages borrowing and spending, potentially leading to inflation if demand exceeds supply.
Interest Rate Lag Effect:
Monetary policy operates with a time lag. It may take several months for interest rate changes to influence inflation meaningfully.
Practical Examples
United States: In the 1980s, the Federal Reserve under Paul Volcker sharply increased interest rates to curb double-digit inflation, successfully restoring price stability.
India: The Reserve Bank of India often adjusts the repo rate in response to consumer price index (CPI) inflation. For instance, during high inflation periods such as 2013 or 2022, the RBI raised rates to maintain price stability.
Conclusion
The relationship between interest rates and inflation is one of the cornerstones of modern macroeconomic management. While inflation represents the rate at which prices increase, interest rates determine the cost of borrowing and the reward for saving. The two are intricately linked through expectations, monetary policy, and the overall balance of demand and supply in the economy.
An optimal policy aims to maintain a balance—interest rates that are neither too high to stifle growth nor too low to fuel inflation. Central banks, through careful monitoring and policy adjustments, strive to achieve price stability and sustainable economic growth. Understanding this delicate relationship is essential for investors, businesses, and policymakers in making informed economic decisions.