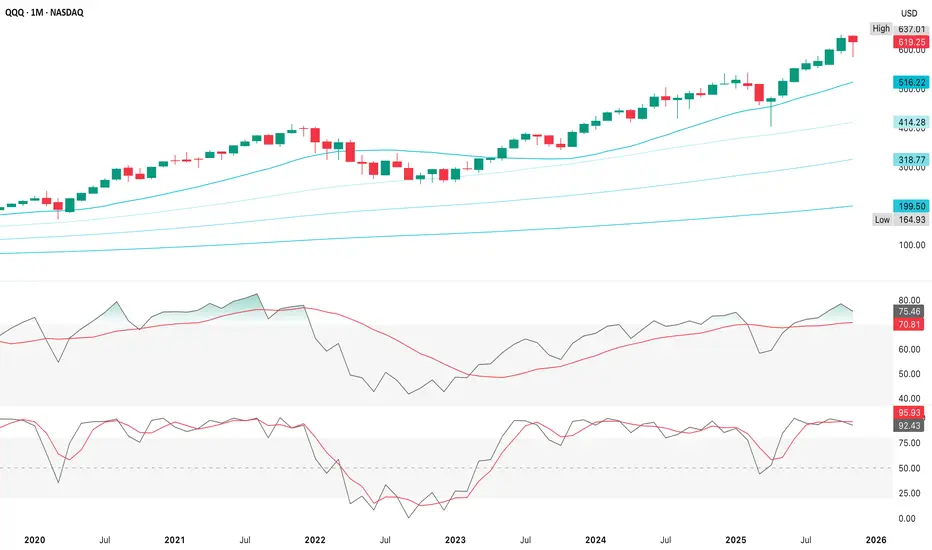
QQQ The Road Not TakenA trend reversal requires a higher high, followed by a higher low that holds & a second higher high - it needs that staircase
Sell volume should decline on dips & buy volume should rise on bounces
QQQ did see rise in volume on the reclaim of the 50d MA & that leans bullish, but we need to see if
Key stats
About Invesco QQQ Trust Series I
Home page
Inception date
Mar 10, 1999
Structure
Unit Investment Trust
Replication method
Physical
Dividend treatment
Distributes
Distribution tax treatment
Qualified dividends
Income tax type
Capital Gains
Max ST capital gains rate
39.60%
Max LT capital gains rate
20.00%
Primary advisor
Invesco Capital Management LLC
Distributor
Invesco Distributors, Inc.
ISIN
US46090E1038
QQQ is one of the most established and actively traded ETFs in the world, albeit one of the most unusual. The product is one of a few ETFs structured as a unit investment trust. Per the rules of its index, the fund only invests in nonfinancial stocks listed on NASDAQ, and effectively ignores other sectors too, causing it to skew massively away from a broad-based large-cap portfolio. QQQ has huge tech exposure, but it is not a 'tech fund' in the pure sense either. The fund's arcane weighting rules further distance it from anything close to plain vanilla large-cap or pure-play tech coverage. The ETF is much more concentrated in its top holdings and is more volatile than our vanilla large-cap benchmark. Still, the fund has huge name recognition for the underlying index, the NASDAQ-100. In all, QQQ delivers a quirky but wildly popular mash-up of tech, growth, and large-cap exposure. The fund and index are rebalanced quarterly and reconstituted annually.
Related funds
Classification
What's in the fund
Exposure type
Electronic Technology
Technology Services
Stock breakdown by region
Top 10 holdings

QQQ (28 November)November's monthly candle is closer to a hanging man than a hammer, but the context determines whether it’s actually bearish, since a true hanging man requires 1) a long lower shadow (yes), 2) a small real body near the top of the range (yes) & 3) appears after a strong uptrend (definitely yes)
T
AI Bubble? Or Risk of a Flash Crash.New Technology that is used too soon and or improperly used before it is fully tested and regulated is, historically, the cause of every prior Flash Crash.
Flash Crashes are not just on the 3 major indexes but also occur on individual stocks, Stock Derivatives, Sectors, and Industries.
New Technolo

November 24 - November 28 2025I have recently identified an area of weakness in my trading style. Too often I find myself front-running trades by setting my bias based on where I think my Macro indicators are headed vs where they are positioned currently. Macro moves much slower than equities, so I should instead be looking for


QQQ Trading Opportunity! SELL!
My dear friends,
QQQlooks like it will make a good move, and here are the details:
The market is trading on 619.15 pivot level.
Bias - Bearish
Technical Indicators: Supper Trend generates a clear short signal while Pivot Point HL is currently determining the overall Bearish trend of the marke

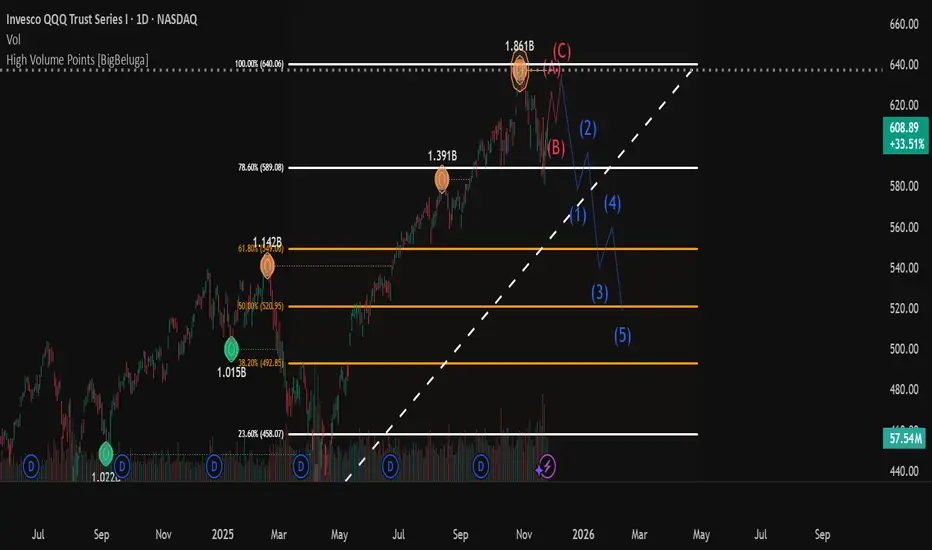
QQQ bullish then bearish?i think were in a topping proccess somthing to watch out for we are already seeing the reasons to be bullish evaporate i think we could possibly take out the high but the aftermath will be brutal! wdy think??
QQQ: Market of Sellers
Looking at the chart of QQQ right now we are seeing some interesting price action on the lower timeframes. Thus a local move down seems to be quite likely.
Disclosure: I am part of Trade Nation's Influencer program and receive a monthly fee for using their TradingView charts in my analysis.
❤️ P

QQQ Liquidation FlushToday was a liquidation flush & the opening price action wasn’t a bounce attempt, since it largely occurred after-hours rather than during regular trading hours
• The failed push was simply a backtest of broken intraday moving averages & not the bounce to the 20d MA that's expected, but today's dr

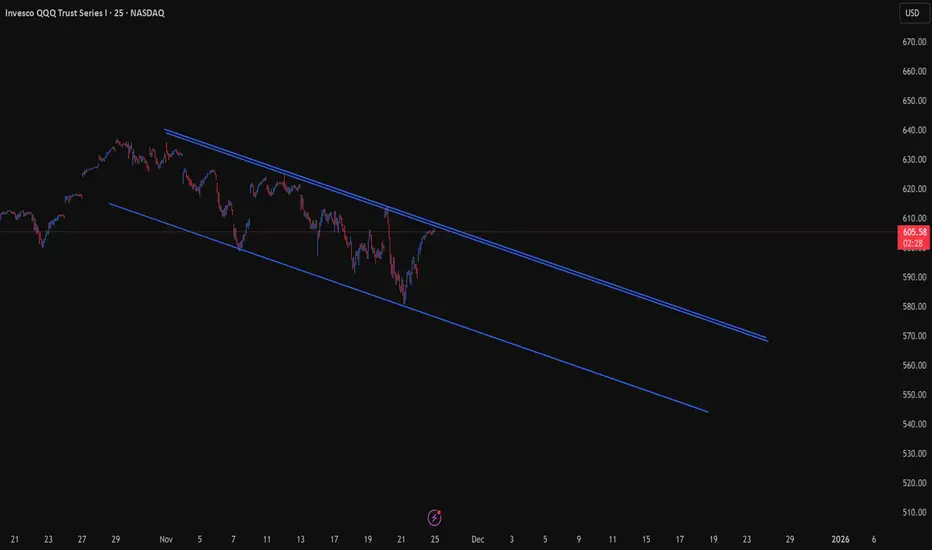
The Geometry of the Week: QQQ Inside the Declining ChannelThis week’s market map centers on a single dominant structure —
a perfect declining parallel channel guiding QQQ through the entire November decline.
Price is now rallying back into the upper rail, the same geometric boundary that rejected every advance this month.
This rail rises at a 1×2 natural
See all ideas
Summarizing what the indicators are suggesting.
Oscillators
Neutral
SellBuy
Strong sellStrong buy
Strong sellSellNeutralBuyStrong buy
Oscillators
Neutral
SellBuy
Strong sellStrong buy
Strong sellSellNeutralBuyStrong buy
Summary
Neutral
SellBuy
Strong sellStrong buy
Strong sellSellNeutralBuyStrong buy
Summary
Neutral
SellBuy
Strong sellStrong buy
Strong sellSellNeutralBuyStrong buy
Summary
Neutral
SellBuy
Strong sellStrong buy
Strong sellSellNeutralBuyStrong buy
Moving Averages
Neutral
SellBuy
Strong sellStrong buy
Strong sellSellNeutralBuyStrong buy
Moving Averages
Neutral
SellBuy
Strong sellStrong buy
Strong sellSellNeutralBuyStrong buy
Displays a symbol's price movements over previous years to identify recurring trends.
Frequently Asked Questions
An exchange-traded fund (ETF) is a collection of assets (stocks, bonds, commodities, etc.) that track an underlying index and can be bought on an exchange like individual stocks.
QQQ trades at 619.25 USD today, its price has risen 0.81% in the past 24 hours. Track more dynamics on QQQ price chart.
QQQ net asset value is 619.23 today — it's risen 0.37% over the past month. NAV represents the total value of the fund's assets less liabilities and serves as a gauge of the fund's performance.
QQQ assets under management is 399.88 B USD. AUM is an important metric as it reflects the fund's size and can serve as a gauge of how successful the fund is in attracting investors, which, in its turn, can influence decision-making.
QQQ price has fallen by −2.57% over the last month, and its yearly performance shows a 21.86% increase. See more dynamics on QQQ price chart.
NAV returns, another gauge of an ETF dynamics, have risen by 0.37% over the last month, showed a 7.43% increase in three-month performance and has increased by 23.24% in a year.
NAV returns, another gauge of an ETF dynamics, have risen by 0.37% over the last month, showed a 7.43% increase in three-month performance and has increased by 23.24% in a year.
QQQ fund flows account for 19.24 B USD (1 year). Many traders use this metric to get insight into investors' sentiment and evaluate whether it's time to buy or sell the fund.
Since ETFs work like an individual stock, they can be bought and sold on exchanges (e.g. NASDAQ, NYSE, EURONEXT). As it happens with stocks, you need to select a brokerage to access trading. Explore our list of available brokers to find the one to help execute your strategies. Don't forget to do your research before getting to trading. Explore ETFs metrics in our ETF screener to find a reliable opportunity.
QQQ invests in stocks. See more details in our Analysis section.
QQQ expense ratio is 0.20%. It's an important metric for helping traders understand the fund's operating costs relative to assets and how expensive it would be to hold the fund.
No, QQQ isn't leveraged, meaning it doesn't use borrowings or financial derivatives to magnify the performance of the underlying assets or index it follows.
In some ways, ETFs are safe investments, but in a broader sense, they're not safer than any other asset, so it's crucial to analyze a fund before investing. But if your research gives a vague answer, you can always refer to technical analysis.
Today, QQQ technical analysis shows the strong buy rating and its 1-week rating is strong buy. Since market conditions are prone to changes, it's worth looking a bit further into the future — according to the 1-month rating QQQ shows the buy signal. See more of QQQ technicals for a more comprehensive analysis.
Today, QQQ technical analysis shows the strong buy rating and its 1-week rating is strong buy. Since market conditions are prone to changes, it's worth looking a bit further into the future — according to the 1-month rating QQQ shows the buy signal. See more of QQQ technicals for a more comprehensive analysis.
Yes, QQQ pays dividends to its holders with the dividend yield of 0.46%.
QQQ trades at a premium (0.00%).
Premium/discount to NAV expresses the difference between the ETF’s price and its NAV value. A positive percentage indicates a premium, meaning the ETF trades at a higher price than the calculated NAV. Conversely, a negative percentage indicates a discount, suggesting the ETF trades at a lower price than NAV.
Premium/discount to NAV expresses the difference between the ETF’s price and its NAV value. A positive percentage indicates a premium, meaning the ETF trades at a higher price than the calculated NAV. Conversely, a negative percentage indicates a discount, suggesting the ETF trades at a lower price than NAV.
QQQ shares are issued by Invesco Ltd.
QQQ follows the NASDAQ 100 Index. ETFs usually track some benchmark seeking to replicate its performance and guide asset selection and objectives.
The fund started trading on Mar 10, 1999.
The fund's management style is passive, meaning it's aiming to replicate the performance of the underlying index by holding assets in the same proportions as the index. The goal is to match the index's returns.